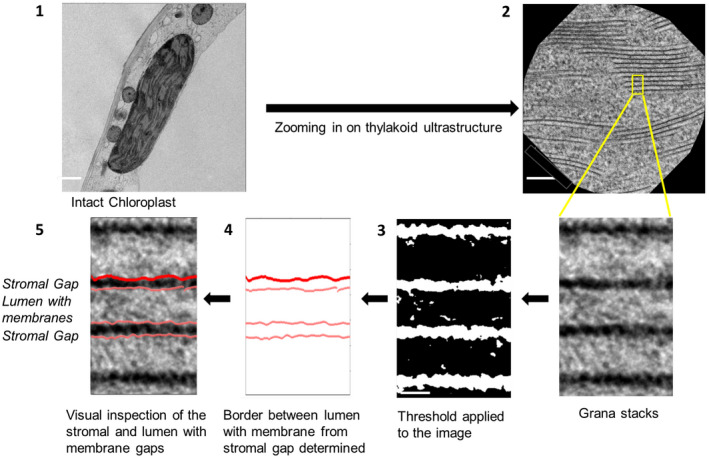
FIGURE 1.

Schematic diagram of the methodology to analyze the TEM images. 1. An intact chloroplast from HPF‐treated leaf tissue is selected; 2. The thylakoid structure of the chloroplast is zoomed in; 3. The image is then converted into a black and white image; 4. Border of stripes are extracted, and borders are plotted; 5. The graph is overlapped to the original image for visual inspection. Scale bars: (1) 1µm, (2) 100 nm, and (3) 5 nm
