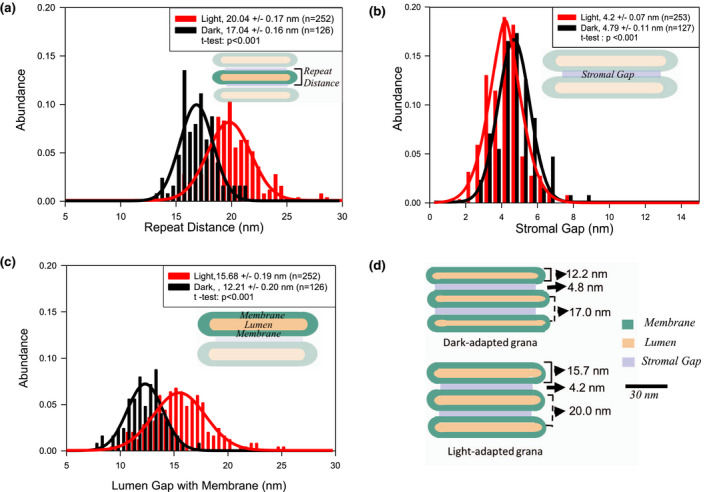
FIGURE 4.

Change in thylakoid architecture in dark‐ and light‐adapted plants after HPF fixation. A. Difference in repeat distance, B. Difference in the stromal gap, C. Difference in the lumen, and D. In‐scale model (in vertical dimension) of grana in dark‐ and light‐adapted thylakoids summarizing the data in A to C. R 2 values for the Gaussian fittings for dark/light–adapted samples are .92/.94 (Figure 4a), .86/.93 (b), and .94/.93 (c)
