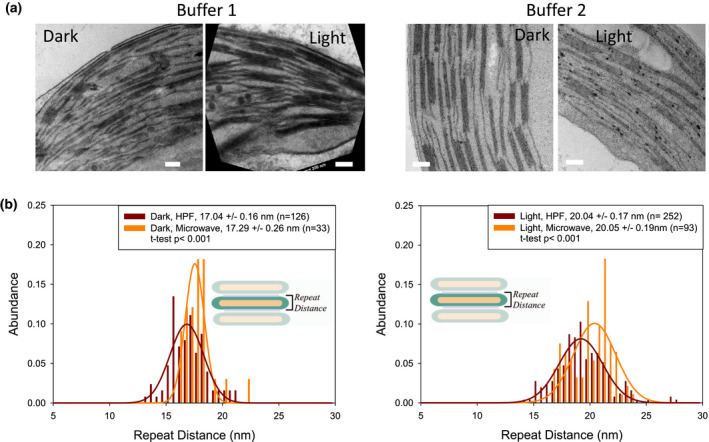
FIGURE 5.

Microwave‐fixed samples. A. Examples of TEM images for dark‐ and light‐treated leaf discs fixed with buffer 1 (left) or buffer 2 (right). Scale bars: 200 nm. B. The difference in repeat distance analysis of microwave‐fixed (buffer 1) versus HPF method for dark‐ and light‐adapted conditions
