FIGURE 7.

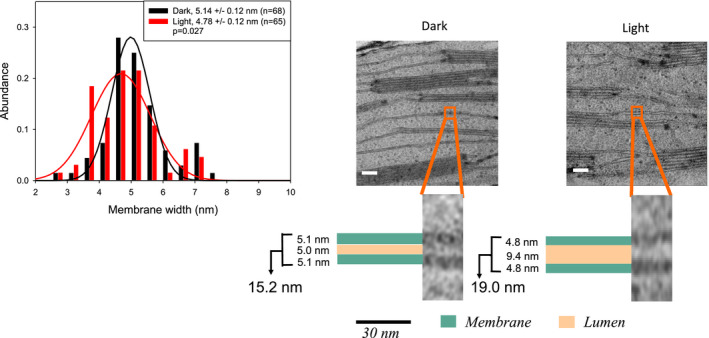
Light‐induced changes in thylakoid stroma lamella structure (right) and membrane thickness (histogram above) from microwave‐fixed samples. Scale bars: 30 nm. R 2 values for the Gaussian fittings for dark/light–adapted samples are .94/.90

Light‐induced changes in thylakoid stroma lamella structure (right) and membrane thickness (histogram above) from microwave‐fixed samples. Scale bars: 30 nm. R 2 values for the Gaussian fittings for dark/light–adapted samples are .94/.90