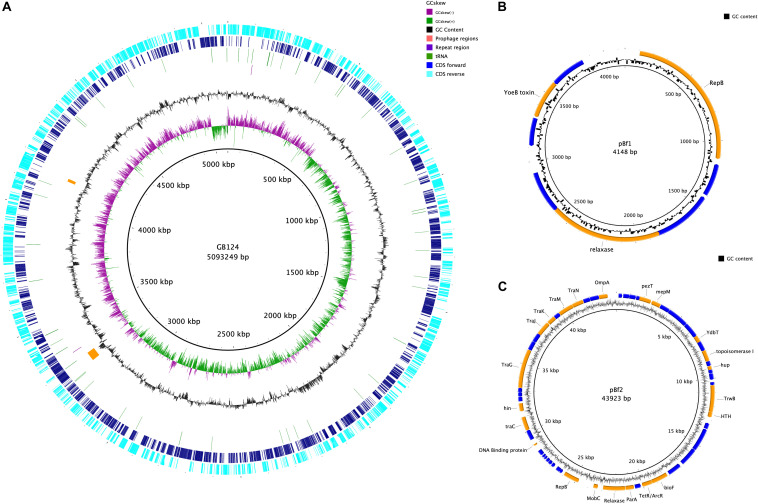
FIGURE 5.
Genome map of B. fragilis GB124 and its plasmids. (A) The outer most ring depicts the coding sequences (CDS) in both anti-clockwise (aqua) and clockwise (blue) orientation. tRNAs are depicted as green arcs with the purple arcs depicting 2 CRISPR repeat regions. The orange arcs depict two prophage regions with by GC content shown as black and GC skewing by green and purple. (B) Circular map of plasmid 1 (S4). The blue coding regions are hypothetical proteins with no known function. The orange coding regions highlights a putative function. (C) Circular map of plasmid 2 (S5) using the same color coding as in panel (B).

