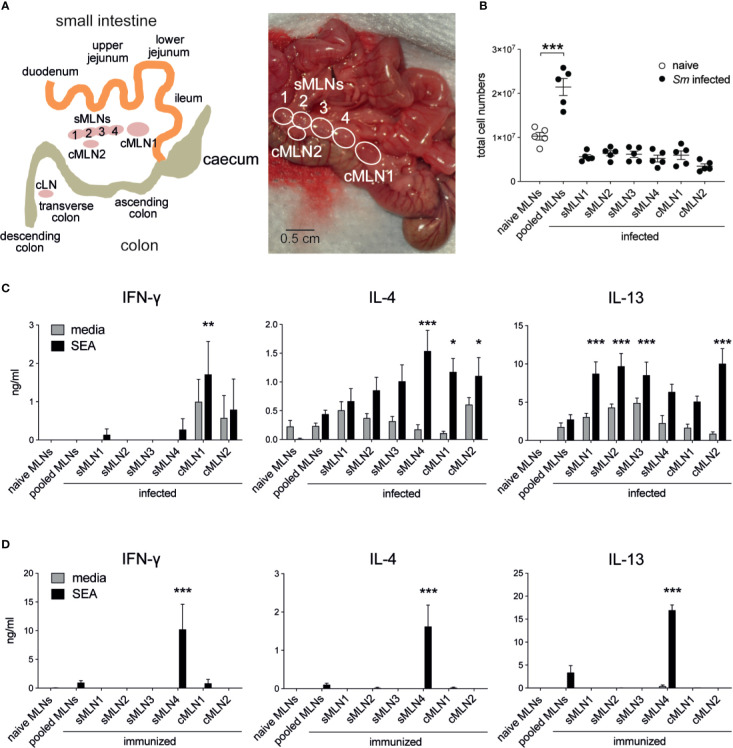
Figure 2.
Th1 and Th2 responses are detected in individual mesenteric lymph nodes after Schistosoma mansoni infection and egg immunization. (A) Schematic and photograph of the murine intestine illustrate the different segments and indicate the position and nomenclature of the individual draining lymph nodes. (B) Total cell counts of pooled or individual mesenteric lymph nodes (MLNs) seven weeks after S. mansoni (Sm) infection (n = 5 mice per group, representative of two independent experiments; mean ± SEM; unpaired t-tests compare cell numbers between naïve and infected groups; **p ≤ 0.01). (C) From the same experiments, pooled or individual lymph node cells were restimulated with SEA or media for 3 days in vitro and Th1 and Th2 cytokines were measured by ELISA (mean ± SEM; two-way ANOVA followed by Dunnett’s multiple comparisons test compare samples to pooled infected MLNs within each restimulation group; *p ≤ 0.05, **p ≤ 0.01, ***p ≤ 0.001). (D) 1,000 S. mansoni eggs were injected into the ileal subserosa and pooled or individual lymph nodes were collected after 5 days. Cells were restimulated with SEA or media for 3 days in vitro and Th1 and Th2 cytokines were measured by ELISA (n = 3 mice per group, combined data from three independent experiments; mean ± SEM; two-way ANOVA followed by Dunnett’s multiple comparisons test compare samples to pooled infected MLNs within each restimulation group; ***p ≤ 0.001).

