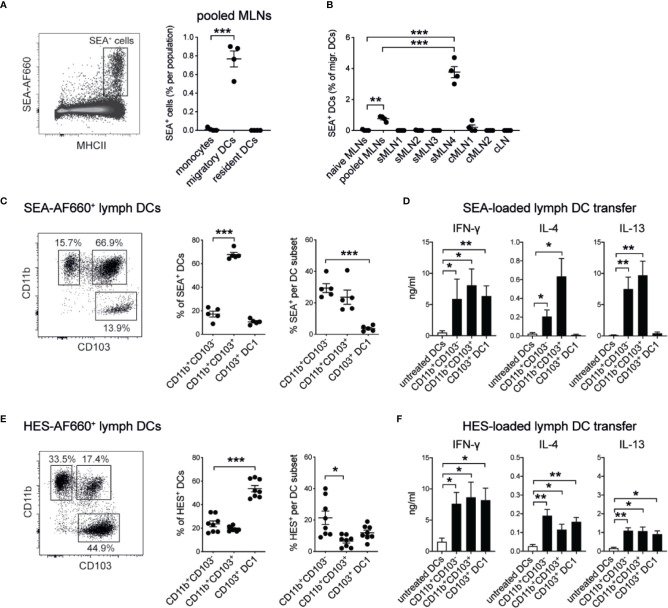
Figure 6.
Soluble helminth antigens are transported to the MLN by distinct subsets of intestinal dendritic cells that prime Th1 and Th2 responses. 15 µg of AF660-labeled antigens were injected into the intestinal serosa and antigen-positive cells were assessed 24 h after injection. (A) Representative dot plot of viable single MLN cells and frequency of SEA-AF660+ cells in pooled MLNs 24 h after ileal injection (n = 4 mice per group, representative of two independent experiments; mean ± SEM; unpaired t-tests compare cell frequencies to monocytes; ***p ≤ 0.001). (B) Frequency of SEA-AF660+ dendritic cells in pooled or individual MLNs 24 h after ileal injection (n = 4 mice per group, representative of two independent experiments; mean ± SEM; ordinary one-way ANOVA followed by Holm–Sidak’s multiple comparisons test compares DC frequencies to naïve controls; unpaired t-test compares pooled MLN to sMLN4 responses; **p ≤ 0.01, ***p ≤ 0.001). (C) DC subset distribution (left and middle) and frequency (right) of SEA-AF660+ lymph DCs collected over 18 h after ileal injection of SEA-AF660 (n = 2–3 mice per group, combined data from two independent experiments; mean ± SEM; unpaired t-tests compare cell distribution and frequencies to CD11b+CD103− DCs; ***p ≤ 0.001). (D) Lymph DC subsets were collected from naïve mice over 18 h, sorted into subsets and incubated with or without 1 mg/ml SEA for 18 h. 30,000 cells were then transferred under the MLN capsule of naïve mice. After 5 days LNs were collected, restimulated with SEA in vitro, and assessed for antigen-specific cytokines by ELISA (n = 2–3 mice per group, combined data from two independent experiments; mean ± SEM; unpaired t-tests compare cytokine responses from transferred SEA-treated DC subsets to untreated DCs; *p ≤ 0.05, **p ≤ 0.01). (E) DC subset distribution (left and middle) and frequency (right) of HES-AF660+ lymph DCs collected over 18 h after ileal injection of HES-AF660 (n = 2–3 mice per group, combined data from two independent experiments; mean ± SEM; unpaired t-tests compare cell distribution and frequencies to CD11b+CD103− DCs; *p ≤ 0.05, ***p ≤ 0.001). (F) Lymph DC subsets were collected from naïve mice over 18 h, sorted into subsets and incubated with or without 1 mg/ml HES for 18 h. 30,000 cells were then transferred into the MLN subcapsule of naïve mice. After 5 days LNs were collected, restimulated with HES in vitro, and assessed for antigen-specific cytokines by ELISA (n = 2–3 mice per group, combined data from two independent experiments; mean ± SEM; unpaired t-tests compare cytokine responses from transferred HES-treated DC subsets to untreated DCs; *p ≤ 0.05, **p ≤ 0.01).

