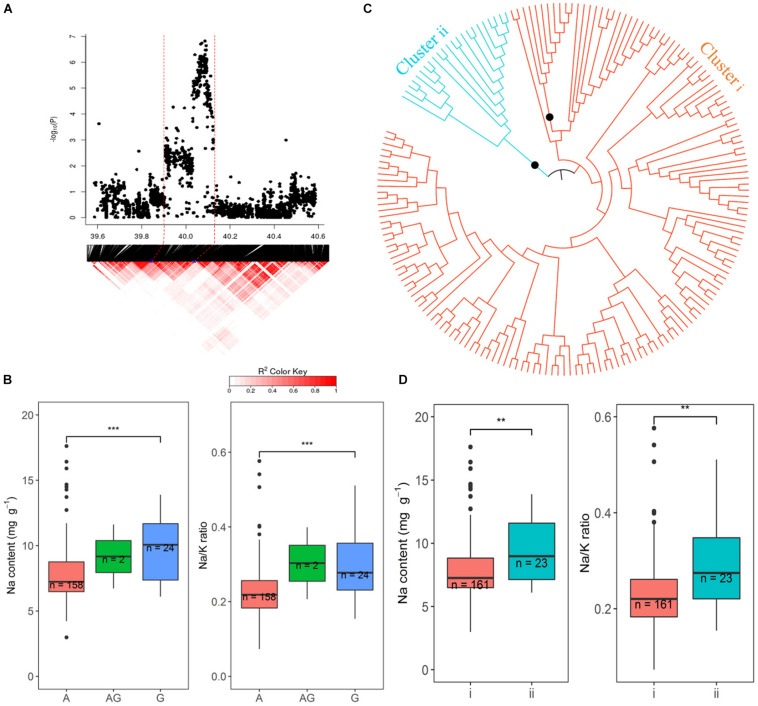
FIGURE 8.
Significant associations for Na content and Na/K ratio on rice chromosome 1 between 39.94 and 40.12 Mb. (A) Local Manhattan plot (top) and LD heatmap (bottom). (B) Range of Na content and Na/K ratio variation observed for each allele for peak SNP 1:40086153. (C) Neighbor-joining tree for the BAAP cultivars for all SNP located between 39.94 and 40.12 Mb on chromosome 1, black circles indicted node support of ≥ 95%. (D) Range of phenotypic variation observed for each cluster in associated traits.

