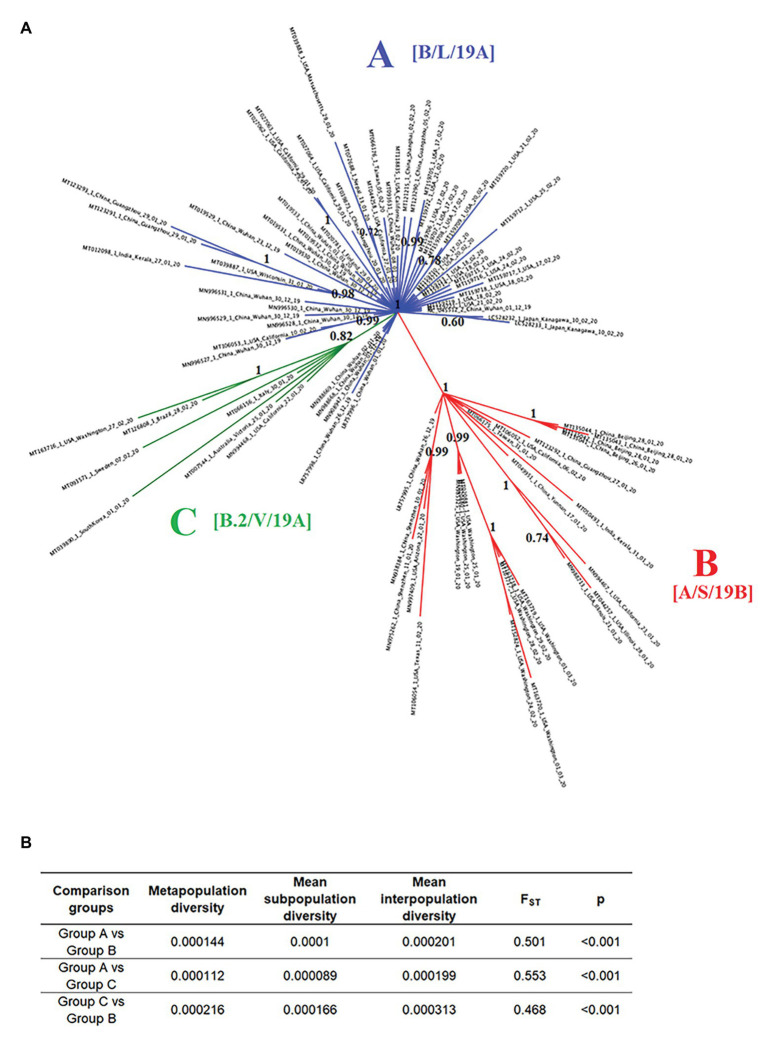
Figure 2.
Phylogeny and population structure analysis of SARS-Cov-2. (A) Bayesian tree reconstructed using 86 SARS-Cov-2 full-length genomes collected from patients naturally infected at different countries, showing the existence of three phylogenetic groups: A (blue), B (red), and C (green). Numbers over the nodes represent their posterior probability. Information in the brackets corresponds with the current nomenclature proposed to describe different lineages reported in our study (https://www.gisaid.org/references/statements-clarifications/clade-and-lineage-nomenclature-aids-in-genomic-epidemiology-of-active-hcov-19-viruses/). (B) Intra- and inter-subpopulation diversity among phylogenetic groups was compared to determine the extent of population structure. FST values >0.33 (p < 0.001) were consider significant.

