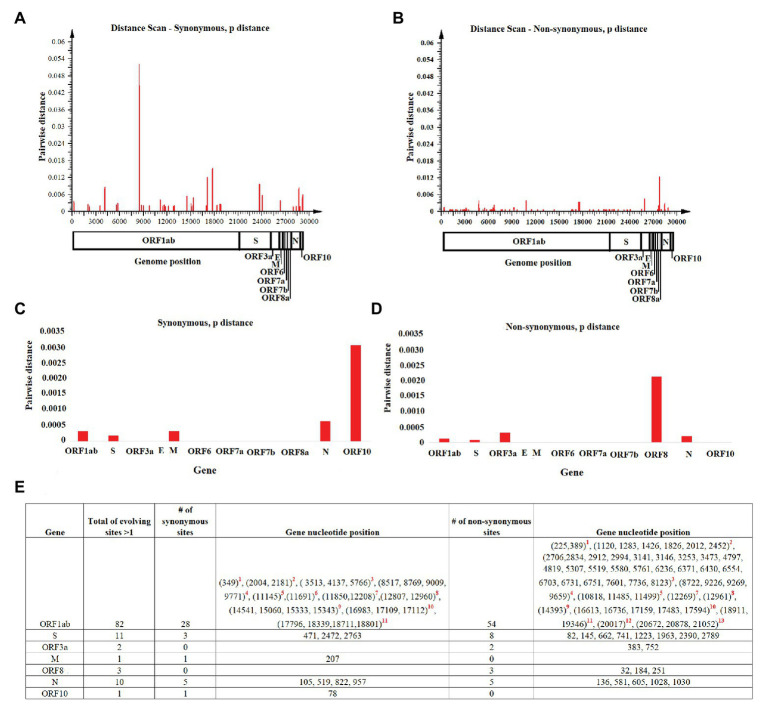
Figure 3.
Pairwise distance analysis. Pairwise distance analysis at (A) synonymous and (B) non-synonymous nucleotide sites was conducted using the program Sequence Distances (software SSE). Red bars represent pairwise distance comparisons using a sliding window of 50 nucleotides. Average nucleotide pairwise distance for different genes is shown at (C) synonymous and (D) non-synonymous sites. (E) Fast-evolving synonymous and non-synonymous sites at each coding region are shown. For these sites, evolutionary rates oscillated between 4.97 and 4.95. Red numbers represent nucleotides at: (1) leader protein, (2) nsp2, (3) nsp3, (4) nsp4, (5) nsp6, (6) nsp7, (7) nsp8, (8) nsp10, (9) RNA independent polymerase, (10) helicase, (11) 3' to 5' exonuclease, (12) endoRNAse, and (13) 2'-O-ribose methyltransferase.

