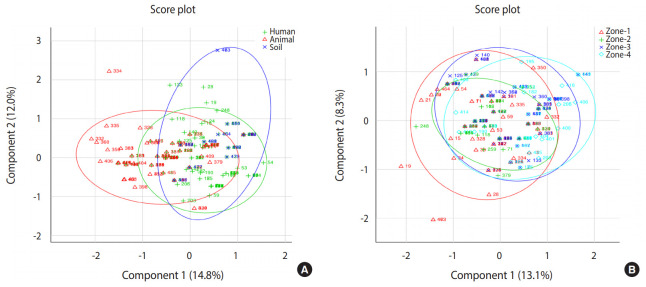
Figure 2.
Principal component analysis. A total of 500 samples were analyzed to see the pattern of diarrheal infectious agents in study region, samples were calculated at 95% similarity. Two samples position in score plot close to each other are more alike and samples positions are far away are dislike from each other. (A) Score plot represents the presence of diarrheal agents in humans, animals and soil samples. Overlapping area in plot represents the similar pattern of infectious agents. (B) Zone wise pattern of infectious agent presented in the study area. Most of the samples share common overlapping zones, which showed all detected pathogens are present almost equally in each study zone.

