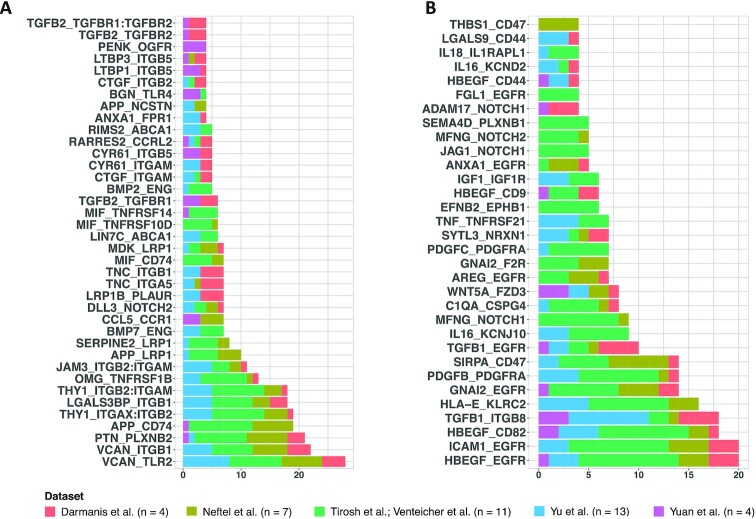
Figure 3:
Paracrine tumor–myeloid cell interactions. Bar plots show significant paracrine L–R interactions (P ≤0.05 and scTHI score ≥0.50) occurring between tumor and myeloid cells shared in ≥4 patients. On the x axis are shown the number of patients in which each interaction occurred. (A) Interaction pairs in which the ligand is expressed on tumor cells and the receptor on myeloid cells. (B) Interaction pairs in which the ligand is expressed on myeloid cells and the receptor on tumor cells. Datasets are from [17, 22–26].

