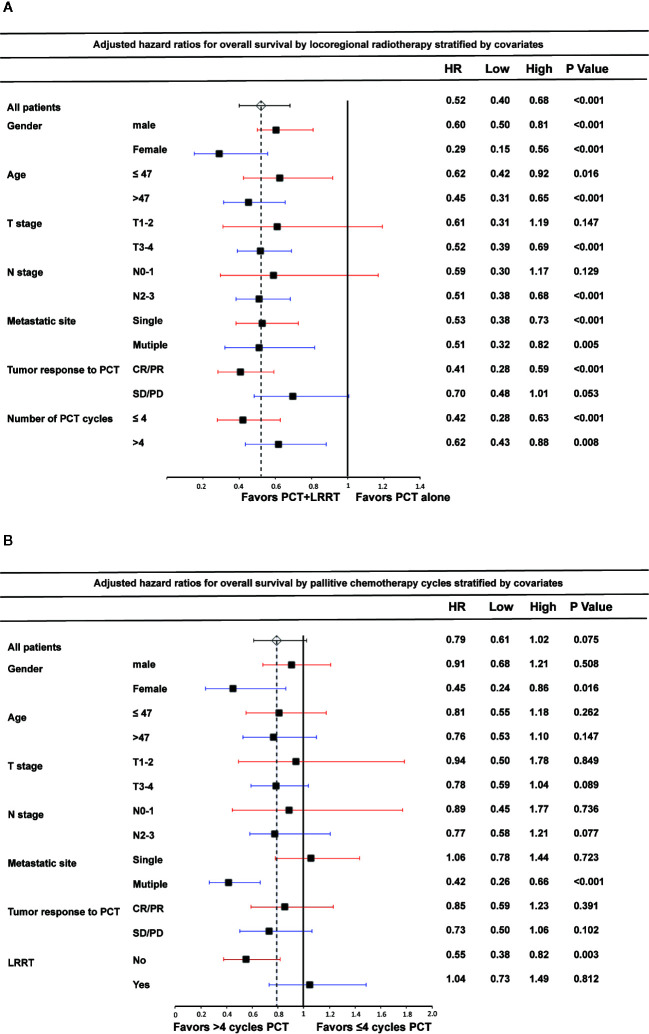
Figure 4.
Forest plot of the association between locoregional radiotherapy (LRRT) and overall survival by subgroup (A); palliative chemotherapy (PCT) cycles and overall survival by subgroup (B). Multivariate hazard ratios (HR) displayed are adjusted for the factors described in the methods section. Low and High refer to the lower and upper limit of the 95% confidence interval, respectively.

