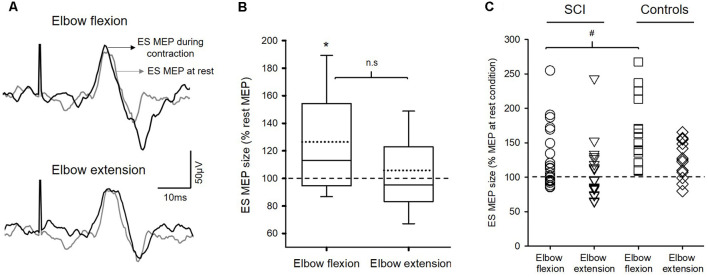
Figure 2.
Motor evoked potentials (MEPs). (A) Raw traces recorded from erector spinae muscles (ES) of a representative subject with T4 incomplete spinal cord injury (SCI). Traces show the average of 10 MEPs in the ES muscle at rest (gray traces) and during 20% of MVC of arm contractions (black traces). (B) Group data (n = 22) showing MEPs in ES between conditions. Solid lines indicate median values; dotted lines indicate mean values. The box is interquartile range; error bars denote maximum and minimum values. The horizontal dashed line represents the size of the ES MEP in the rest condition. Note that the amplitudes of MEP in the ES muscle increased during elbow flexion but not during elbow extension. *p < 0.05, comparison between rest and the voluntary contractions. n.s, nonsignificant. (C) Note that SCI participants (circle and reversed triangle) who show increased MEPs during either elbow flexion or extension have the amount of facilitation similar to the controls (square and diamond). Also, the majority of SCI participants show increases in ES MEPs during elbow flexion compared with rest. #p < 0.05, comparison between SCI subjects and the controls.

