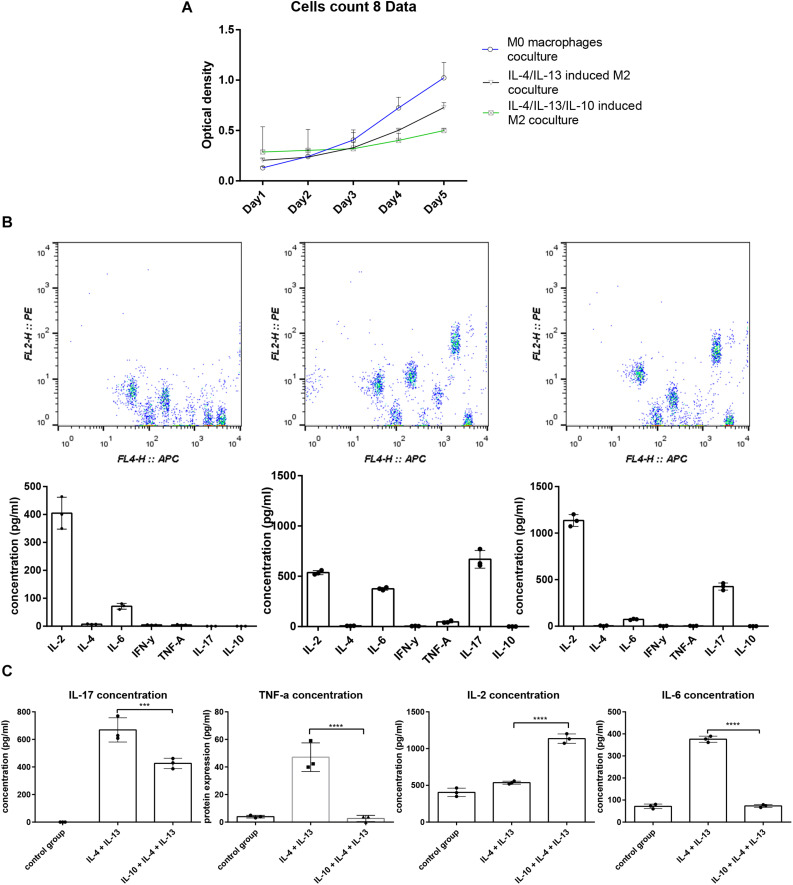
FIGURE 2.
The splenocyte proliferation analysis and cytokine profile difference cocultured with macrophages. (A) Five days of splenocyte proliferation in the mixed culture using CCK-8 kit. The relative cell count is represented by optical density (OD) value. (B) CBA analysis of cytokine profiles in the supernatant of mixed culture; the IL-4, IL-13, and IL-10 groups exhibited higher IL-2, IL-6, TNF-α, and lower IL-17 concentration compared to the IL-4, IL-13 group.

