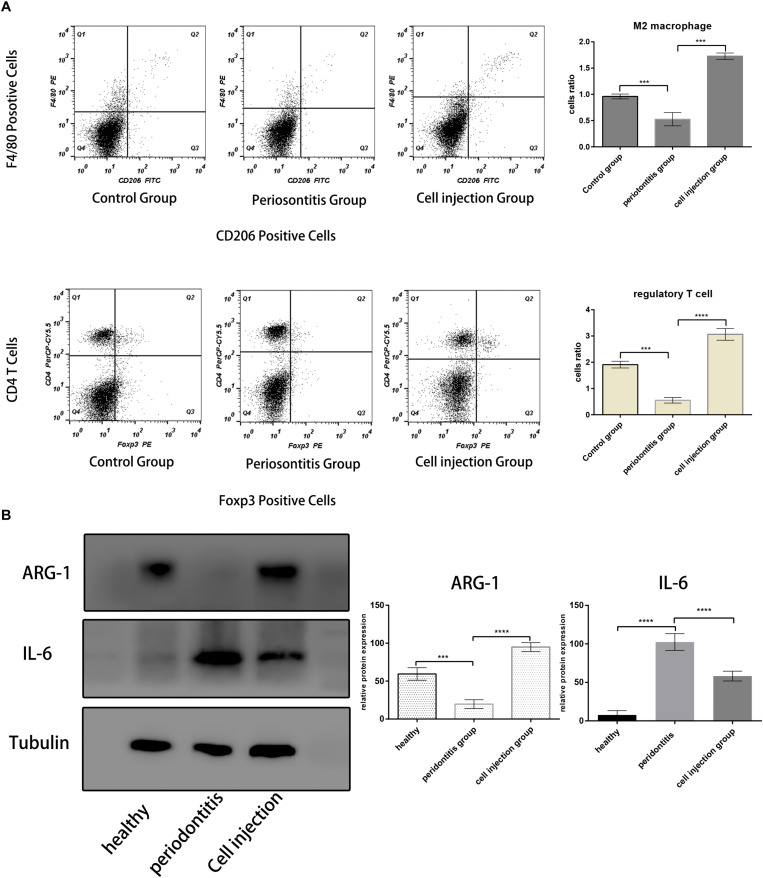
FIGURE 3.
M2 macrophages and regulatory T cell population analysis. (A,B) Flow cytometric analysis of cells in the mice periodontal tissue in each group. The M2 macrophages were gated with F4/80+ and CD206+; the Treg cells were gated with CD4+ and Foxp3+. Both the ratios of F4/80+ and CD206+ cells and CD4+ and Foxp3+ cells are lower in the periodontitis group and higher in the healthy group and cell injection group. (C) Western blot analysis of IL-6 and ARG-1 protein in the gingival tissue. The statistical significance was determined by P-value (***P < 0.001, ****P < 0.0001).

