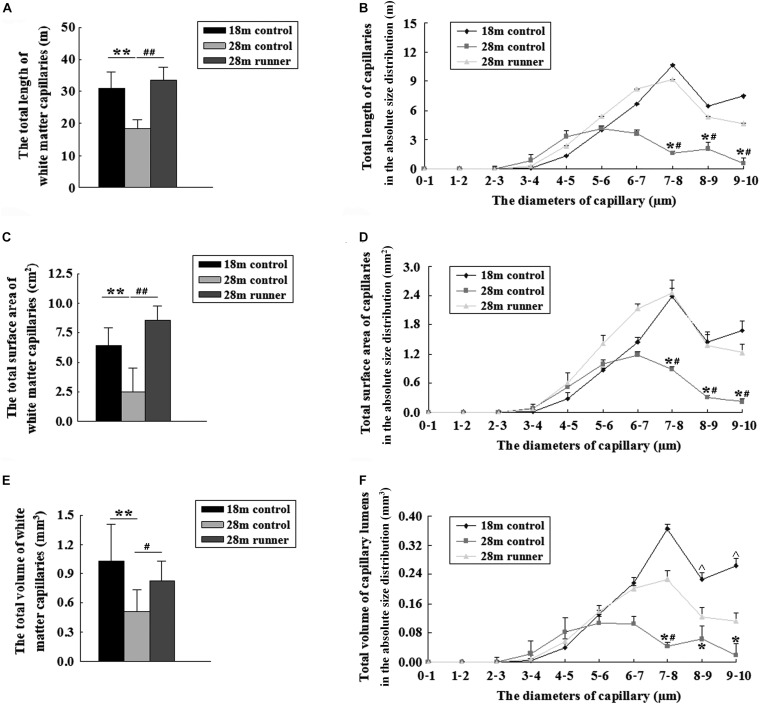
FIGURE 4.
(A) The total length of the capillaries in the white matter of the three groups: the 18-month-old control group (18 m control), 28-month-old control group (28 m control), and 28-month-old runner group (28 m runner). (B) The absolute distributions of the total length of the capillaries within the white matter of the three groups. (C) The total surface area of the capillaries in the white matter of the three groups. (D) The absolute distributions of the total surface area of the capillaries within the white matter of the three groups. (E) The total volume of the capillaries in the white matter of the three groups. (F) The absolute distributions of the total volume of the capillaries within the white matter of the three groups. ∗p < 0.05 when 28 m control is compared to 18 m control. ∗∗p < 0.01 when 28 m control is compared to 18 m control.#p < 0.05 when 28 m control is compared to 28 m runner. ##p < 0.01 when 28 m control is compared to 28 m runner. ^p < 0.05 when 18 m control is compared to 28 m runner.

