Figure 3.
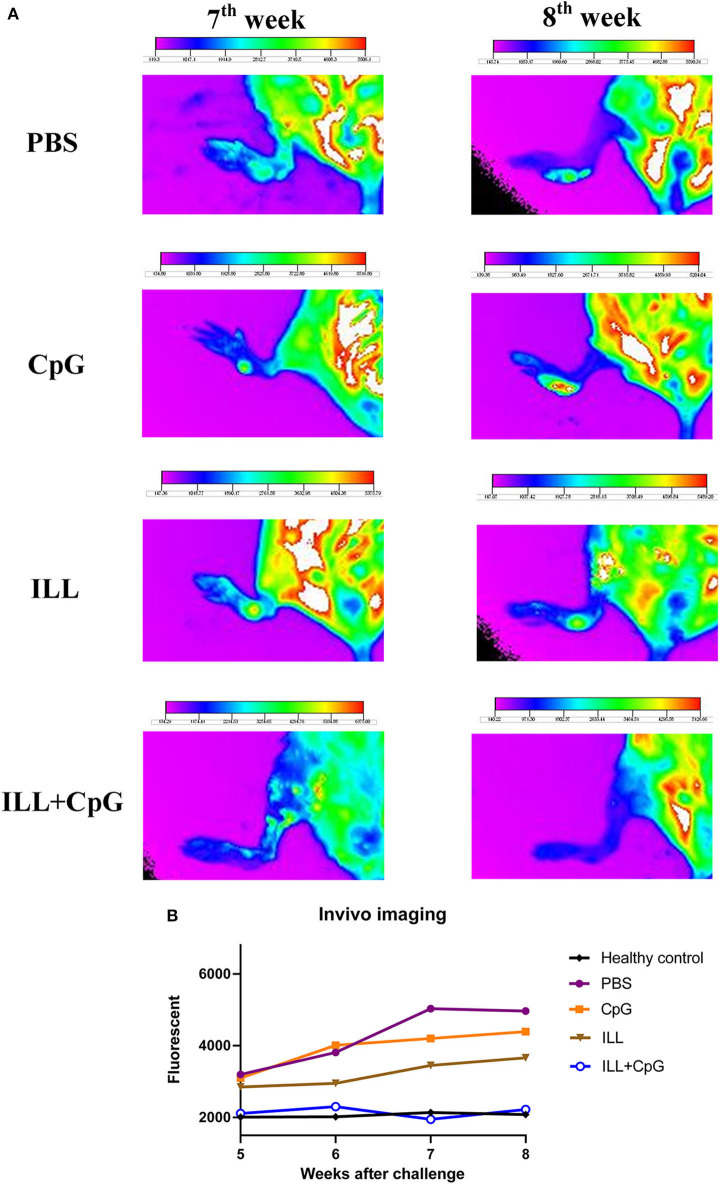
In vivo fluorescent imaging. (A) Fluorescent imaging was used to evaluate dynamic L. majorEGFP load at the site of infection (left footpad). Seven-weeks after the challenge with L. majorEGFP, one mouse from each group was selected randomly and in vivo-imaging was performed. The fur of the leg was shaved and the mouse was anesthetized using Isoflurane 2% through the inhalation route, before imaging. The higher fluorescent intensity in the footpad indicates a higher parasitic load at the injection site. The arrows show the lesion site. Fluorescent intensity bar was drawn using Kodak Molecular Imaging software for each photo. (B) Considering the intensity bar, results showed that the ILL+CpG group had the lowest parasite load that was similar to the healthy group. Statistical analysis could not be performed because only one mouse per group was imaged. I.L.L (Iranian Lizard Leishmania), ILL+CpG (Iranian Leishmania Lizard+CpG).

