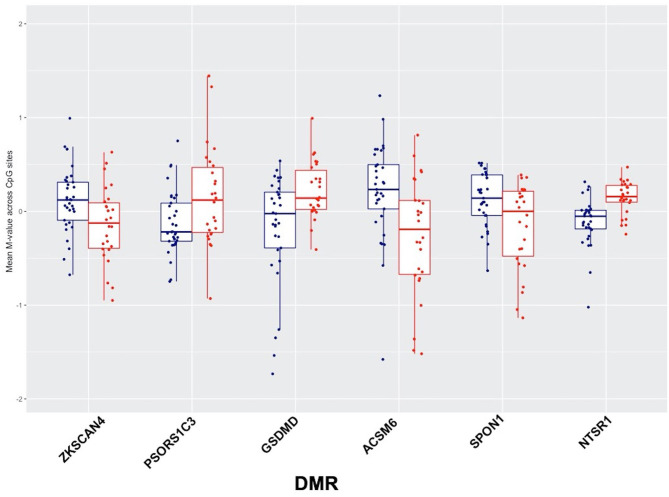
Figure 2.
Six significantly differentially methylated regions (DMRs) identified using the combined p-value tool in high relative to low-blast exposed groups, showing low blast exposed groups in blue and high blast exposed groups in red, with mean methylation (represented by M-values) across CpG sites for each subject on the y-axis.

