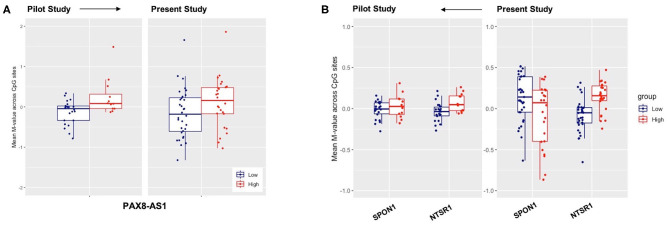
Figure 4.
Replication of previously reported genes for low-high blast exposure analyses of genes (A) PAX-AS1 and (B) SPON1 and NTSR1, with mean methylation M-values across CpG sites on the y-axis and the respective mean M-value across CpG sites for both low-(blue) and high (red) lifetime blast exposed individuals.

