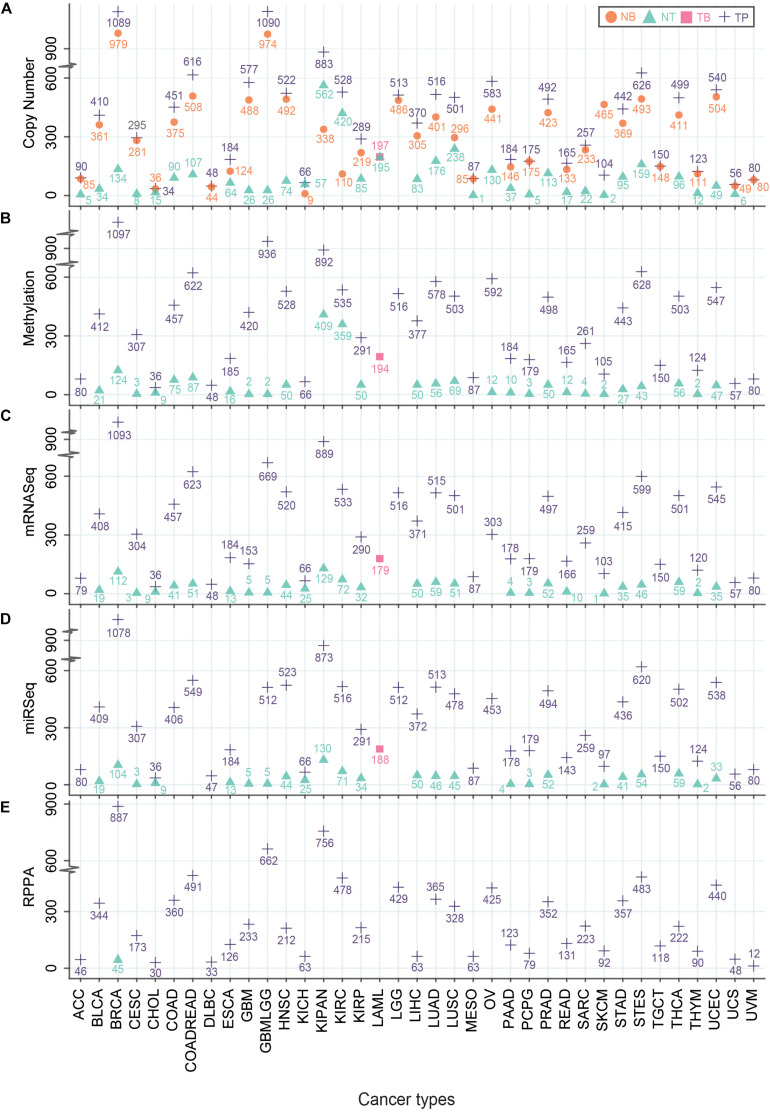
FIGURE 2.
Number of different TCGA-samples across multi-omics platforms. Different types of TCGA samples – Primary Solid Tumor (TP), Blood-Derived Normal (NB), Primary Blood-Derived Cancer – Peripheral Blood (TB) and Solid Tissue Normal (NT) that were used to generate multi-omics data – Genomics: Copy number analysis (A), Epigenomics: Methylation values (B), Transcriptomics: RNA-seq (C), miRNA-seq (D) and Proteomics: RPPA (E) were plotted. The Y-axis represents the number of samples where the X-axis indicates TCGA cohorts. Different symbols represent the type of samples.

