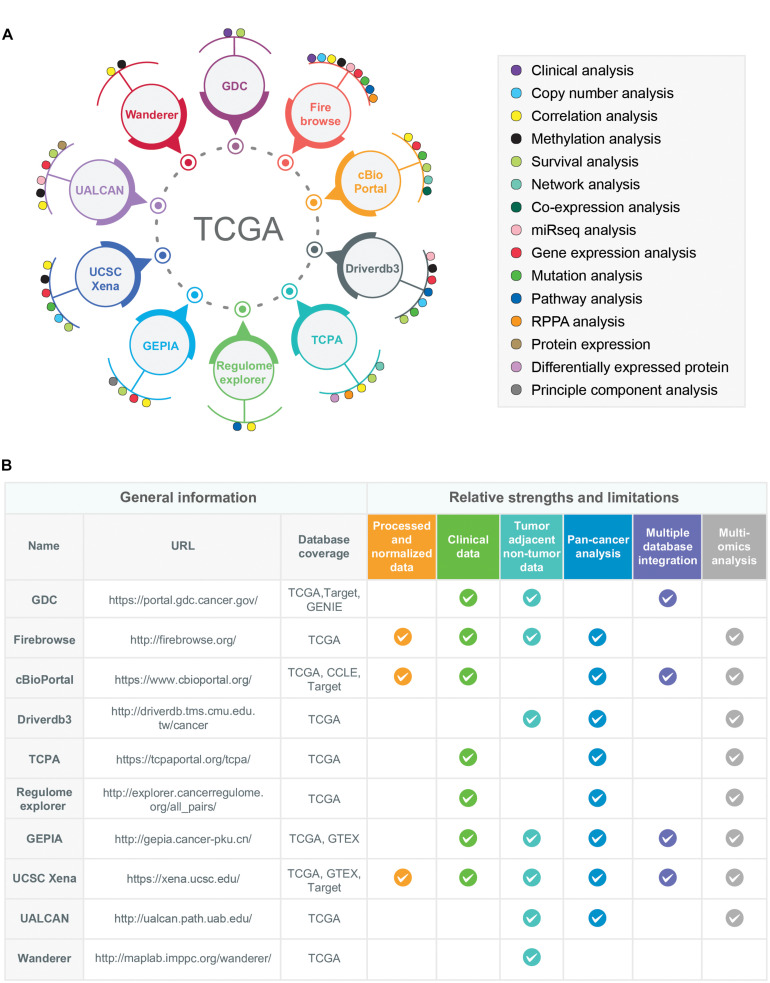
FIGURE 3.
Examples of multidimensional online data portals and visualization tools of TCGA data resources. (A) 10 different online data portals, analysis, and visualization tools of TCGA data are shown. The data-analysis dimensions for each of the online data-portals and tools are indicated by colored circles. (B) The relative strengths and limitations of TCGA-associated online data portals and tools are shown. For the comparison purposes, six different criteria have been selected: Availability of processed/normalized data, clinical data, tumor-adjacent non-tumor data, pan-cancer analysis features, multiple database integration options (databases other than TCGA), and multi-omics analysis options. The availability of these features in a particular data portals or tools is shown as a tick mark. Moreover, the databases covered by each web portal and tools were also given in the column names “Database coverage.” The URLs of each data portal/tools are provided in the URL column.

