
Figure 2.
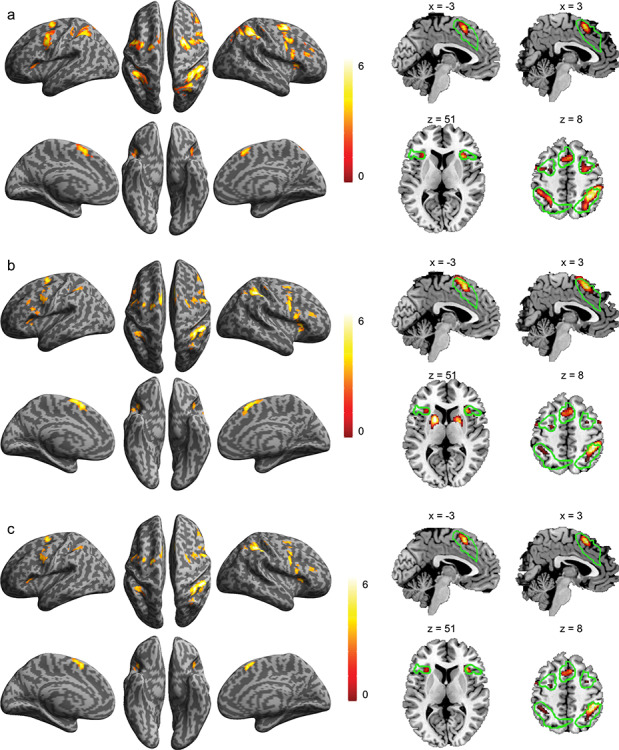
Brain regions involved in uncertainty processing. Brain regions that showed a significant monotonic increase in activation as a function of cognitive load for the SMFT-V (a) and for the SMFT-A (b) and the conjunction across the two tasks (c). The color bar indicates T value. Left column: Surface view. Right column: Sagittal view (top) and axial view (bottom), with the green contours showing the cluster of regions of the CCN identified in our previous meta-analytic study.