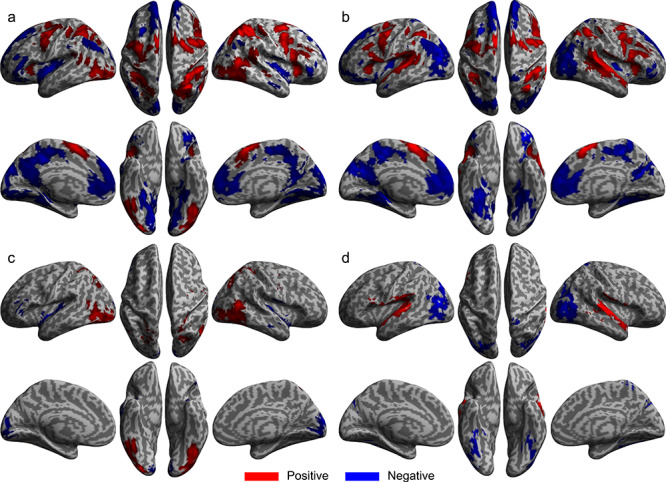
Figure 4.

General and specific brain activation for SMFT-V and SMFT-A. Brain regions that showed significant activation change for all stimulus-locked regressors minus baseline for the SMFT-V (a) and for the SMFT-A (b). Brain regions that showed significant visual-specific (c) and auditory-specific (d) activation. Red: Region that showed an increase in activation. Blue: Region that showed a decrease in activation.
