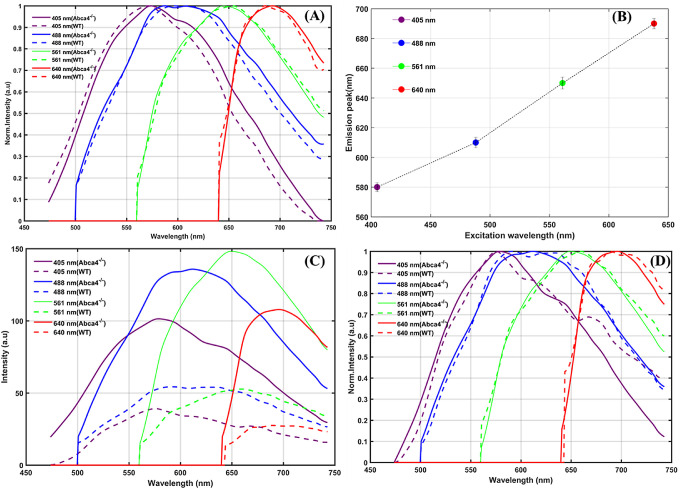
Figure 6.
Averaged emission spectra measured from the flat-mounted RPE for four different excitation wavelengths. (A) Average normalized emission spectra measured from individual lipofuscin granules of an Abca4−/− and a WT control. (B) Shifts in emission maximum of lipofuscin granules with different excitation. (C) Average emission spectra calculated from the whole RPE confocal volume acquired. (D) Normalized intensity spectra from C. Average emission spectrum of lipofuscin granule provided in A was calculated from 100 granules from two eyes of two mice of Abca4−/− and a WT control. The average emission spectra measured from RPE confocal volume provided in C were calculated from three eyes of three mice of Abca4−/− and a WT control.

