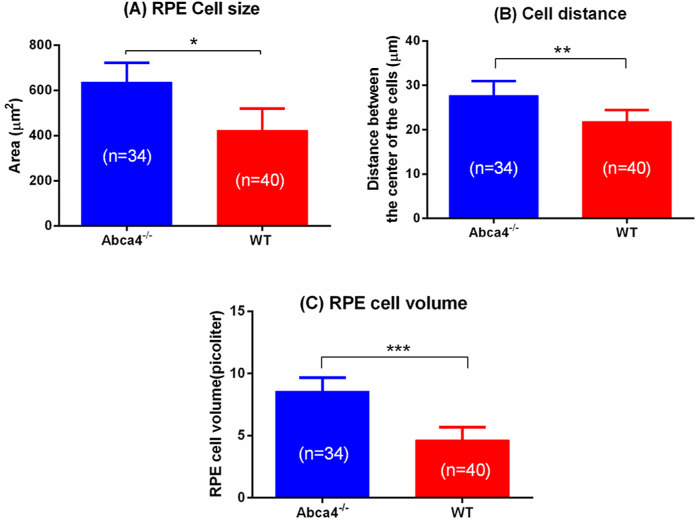
Figure 8.
(A) Size of the RPE cells. (B) RPE cell separation. (C) Volume of RPE cells in Abca4−/− and WT controls. Error bars represent standard errors (*P < 0.001, **P < 0.005, and ***P < 0.001). Average and standard errors are calculated from 34 RPE cells of Abca4−/− and 40 RPE cells of WT from three eyes of three mice of each strain.

