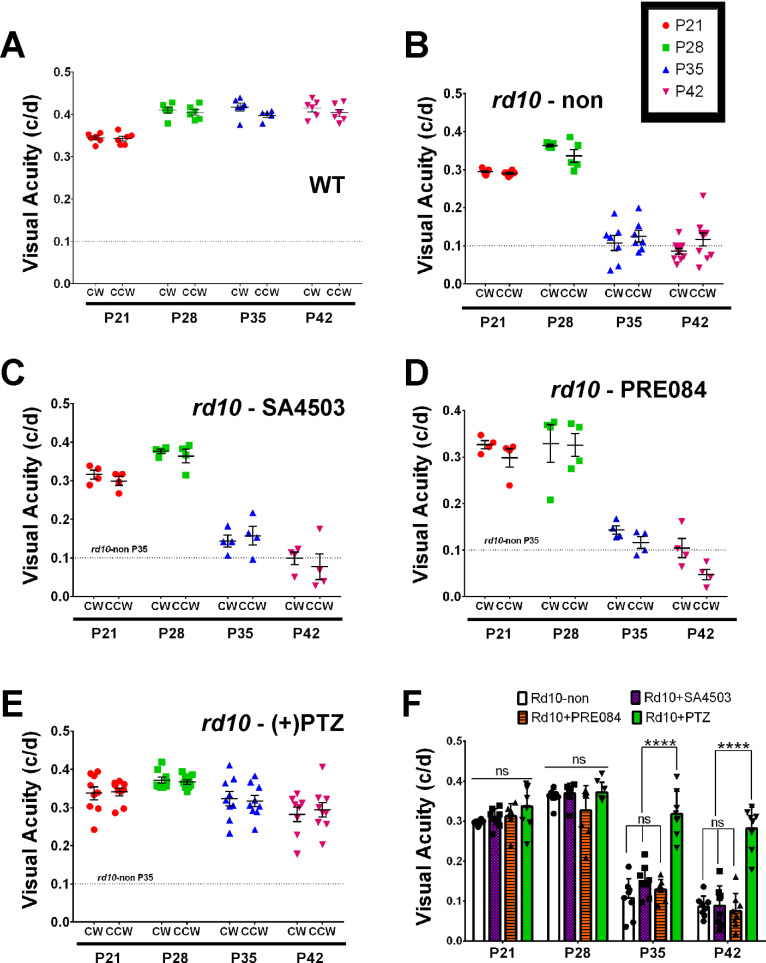
Figure 5.
Assessment of visual acuity in rd10 mice treated with SA4503, PRE084, or (+)-PTZ. The rd10 mice were administered SA4503, PRE-084, or (+)-PTZ every other day beginning at P14 and visual acuity was compared with WT and nontreated rd10 mice. The optokinetic tracking response (OKR) was recorded at P21, P28, P35, and P42. Data are expressed as cycles/degree (c/d) for (A) WT mice, (B) nontreated rd10 mice, (C) rd10-SA4503 mice, (D) rd10-PRE084 mice, and (E) rd10-(+)-PTZ mice. (F) Data from panels A–E are summarized to reflect statistical significance among treatment groups. Two-way ANOVA, significance is depicted as: ****P < 0.0001, ns = not significant. CW = left eye, CCW = right eye. As a reference, a feint dotted line has been inserted in panels A–E to reflect visual acuity of rd10 mice at P35.

