Figure 1.

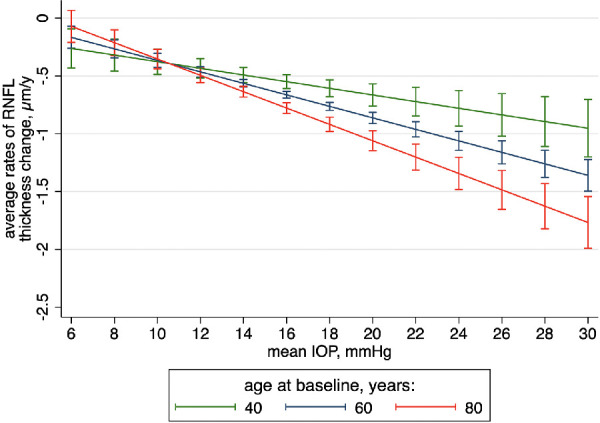
Trajectories of changes in RNFL thickness over time across levels of IOP for 40-, 60-, and 80-year-old average subjects from the whole sample. Other covariates were set to their mean values. Capped spikes indicate 95% CIs.

Trajectories of changes in RNFL thickness over time across levels of IOP for 40-, 60-, and 80-year-old average subjects from the whole sample. Other covariates were set to their mean values. Capped spikes indicate 95% CIs.