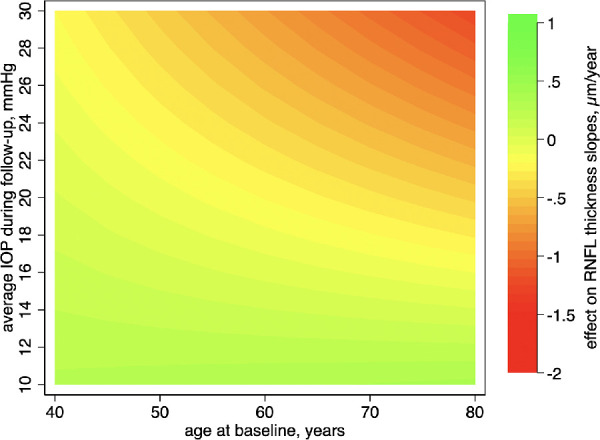
Figure 2.

Contour plot showing the effect of the interaction between mean IOP and age on rates of RNFL thickness change over time. Readers can examine the x-axis values to estimate the influence of average IOP (y-axis) on the rates of RNFL thickness change over different age groups. The average rate of RNFL thickness loss (–0.70 µm/year) was subtracted from the predicted rate of change for each given age and mean IOP, so the results can be interpreted as either protective (green, or slower rates of change) or harmful (warmer colors, or faster rates of change) in relation to the average rate of change of the sample.
