
Figure 3.
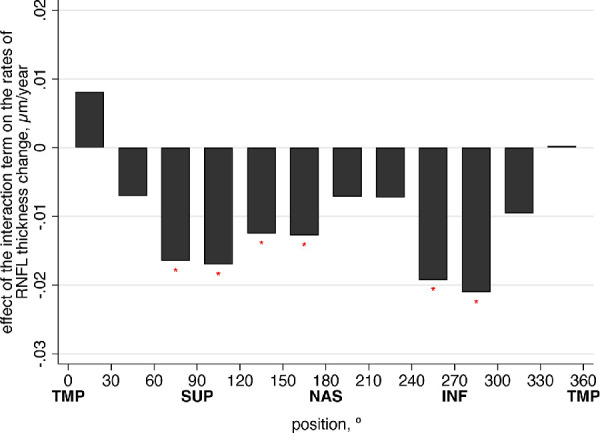
Effect of the interaction term (baseline age and average IOP during follow-up) on the rates of peripapillary RNFL thickness change for each sector. Coefficients were derived from multivariable models adjusted for gender, race, glaucoma diagnosis, CCT, follow-up time, and baseline RNFL thickness in each sector. Asterisk indicates statistical significance (P < 0.05). Sectors start at the temporal cardinal point as 0° (clock hour 9), proceeding clockwise around the optic disc in 30° steps, correlating to the report of the Spectralis SD-OCT. INF, inferior; NAS, nasal; SUP, superior; TMP, temporal.