
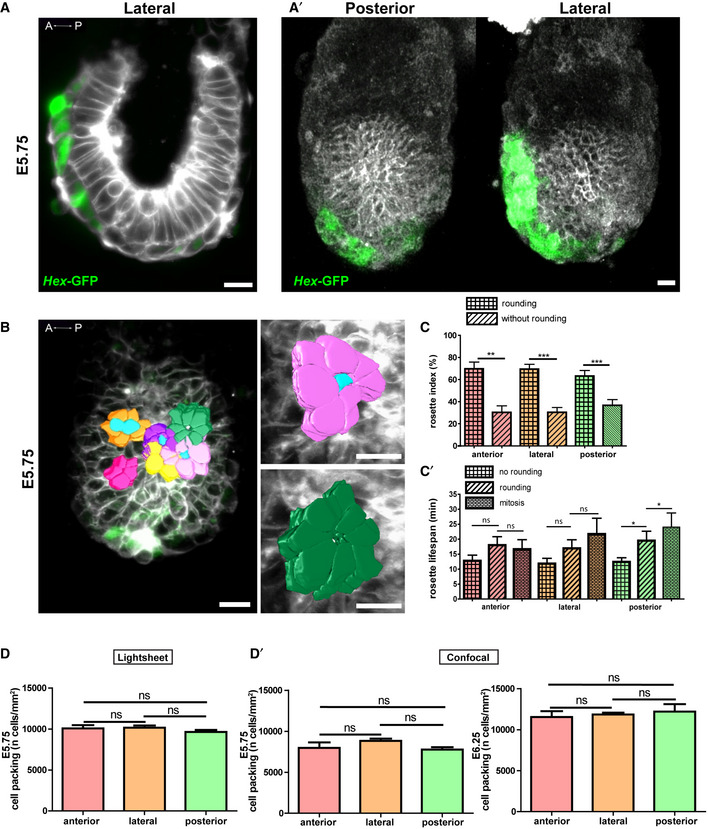
Figure EV2. Embryo orientation for lightsheet and confocal imaging, and quantification of rosettes linked to apical cell rounding.
-
AZ‐projection of the middle section of an embryo imaged by lightsheet microscopy, shown in a lateral view with anterior to the left. Cell shape can be easily segmented. Scale bar: 20 μm. (A′) 3D rendering of an embryo imaged by confocal microscopy, shown in posterior (left) and lateral (right) views. Scale bar: 20 μm. In (A) and (A′), AVE cells are identified through the Hex‐GFP reporter, allowing embryo antero‐posterior orientation.
-
BLeft panel: 3D rendering of the apical side of manually segmented rosettes from an embryo imaged using lightsheet microscopy. Scale bar: 20 μm. Highlighted in light blue are rounded cells localized at the centre of the rosette. Right panels: zooms of a rosette linked to a rounded apical cell (top) and a rosette without an apically rounded cell (bottom). Scale bar: 20 μm.
-
CRosette rounding index: rosettes with or without a central apical rounded cell over total rosettes in percentage and (C′) lifespan (min) of rosettes when associated with a central mitotic, central round or no cell in the anterior, lateral and posterior regions of the embryo. The posterior region includes the PS region. Data information: Mean ± SEM, n = 41 frames from three embryos. Normality was assessed using a Shapiro–Wilk test followed by Kruskal–Wallis and Mann–Whitney tests. ns, non‐significant, *P‐value ≤ 0.05 and ***P‐value ≤ 0.001.
-
DCell packing (number of cells/area in mm2) for E5.75 embryos imaged by lightsheet microscopy, at the anterior, lateral and posterior regions. Data information: Mean ± SEM, n = 41 frames from three embryos. Normality was assessed using a Shapiro–Wilk test followed by a Kruskal–Wallis test. ns: non‐significant. (D′) Cell packing (number of cells/area in mm2) for E5.75 (Left) and E6.25 (Right) embryos imaged by confocal microscopy, at the anterior, lateral and posterior regions. Data information: Mean ± SEM. E5.75: n anterior = 19 frames from three embryos, n lateral = 23 frames from five embryos, n posterior = 20 frames from three embryos. E6.25: n anterior = 16 frames from two embryos, n lateral = 12 frames from one embryo and n posterior = 16 frames from two embryos. Normality was assessed using a Shapiro–Wilk test followed by a Kruskal–Wallis test. ns, non‐significant.
Source data are available online for this figure.