
Figure EV3. dN20::H6 SecA binds to Ni‐lipid‐containing liposomes and translocates substrates.
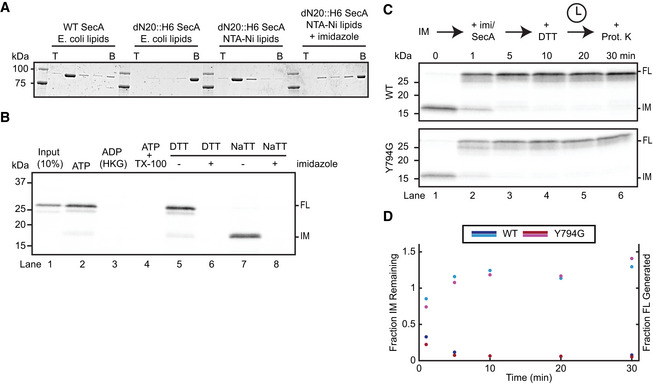
- Binding of SecA to liposomes was determined with a flotation assay. WT or dN20::H6 SecA was incubated with liposomes containing E. coli polar lipids with or without Ni‐NTA lipids. Imidazole was added, where indicated. The samples were loaded at the bottom (B) of a Nycodenz step gradient. After centrifugation, fractions were collected from the top (T) and analyzed by SDS–PAGE and Coomassie‐blue staining. The gel is representative of two replicates.
- ProOmpA was synthesized in reticulocyte lysate in the presence of 35S‐methionine and mixed with dN20::H6 SecA and SecYEG proteoliposomes containing Ni‐NTA lipids. Imidazole was added to the reactions where indicated. After incubation in the presence of ATP, the samples were treated with proteinase K to degrade any non‐translocated material. Where indicated, the reaction was performed in the absence of ATP and proteolysis in the presence of Triton X‐100 (TX‐100). Translocation reactions were performed in the presence of the reducing agent DTT or oxidizing agent NaTT, generating protease‐protected full‐length (FL) substrate or a translocation intermediate (IM), respectively. All samples were analyzed by SDS–PAGE followed by autoradiography. Lane 1 shows 10% of the input sample. The gel is representative of three replicates.
- A translocation intermediate (IM) was formed with dN20::H6 SecA using substrate with a C‐terminal disulfide bridge. Imidazole and WT or mutant SecA was then added, as indicated. After 10 min of incubation, DTT was added and the samples further incubated for the indicated times. All samples were treated with proteinase K (Prot. K) and analyzed by SDS–PAGE and autoradiography.
- Quantification of (C). Points show band intensities normalized to the 0‐min time point for each replicate. Lines show average of replicates. The intensities of both the IM (dark colors) and FL (light colors) bands were measured.
Source data are available online for this figure.