
Figure EV2. Effects of Reno1, lnc‐Nr2f1, and Cox10as1 KD on neuronal differentiation.
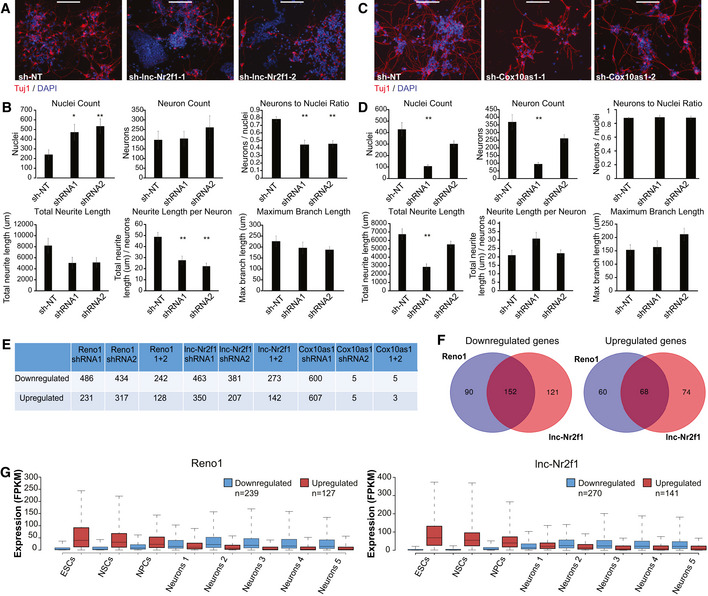
- Immunostaining using anti‐Tuj1 antibody of ES‐cell-derived neurons following infection with either sh‐NT, or two different shRNAs targeting lnc‐Nr2f1. Scale bar: 200 μm.
- Quantification of cell numbers and neurite lengths of ten images of non‐overlapping fields for each shRNA targeting lnc‐Nr2f1 or sh‐NT. Mean ± SEM is shown, *P < 0.05, **P < 0.01 (unpaired two‐sample t‐test).
- Immunostaining using anti‐Tuj1 antibody of ES‐cell-derived neurons following infection with either sh‐NT, or two different shRNAs targeting Cox10as1. Scale bar: 200 μm.
- Quantification of cell numbers and neurite lengths of 10 images of non‐overlapping fields for each shRNA targeting Cox10as1 or sh‐NT. Mean ± SEM is shown, **P < 0.01 (unpaired two‐sample t‐test).
- Number of genes which were significantly (P < 0.01, DESeq2) down‐ or upregulated following KD of Reno1, lnc‐Nr2f1, or Cox10as1.
- Overlap between genes that were significantly down‐ (left) or upregulated (right) following Reno1 and lnc‐Nr2f1 KD.
- Boxplots indicating the median, quartiles, and 5th and 95th percentiles of expression levels of genes which were down‐ or upregulated following KD of Reno1 or lnc‐Nr2f1 during the same neuronal differentiation time points described in Fig 2C. The numbers of genes in each group are indicated in the legend.