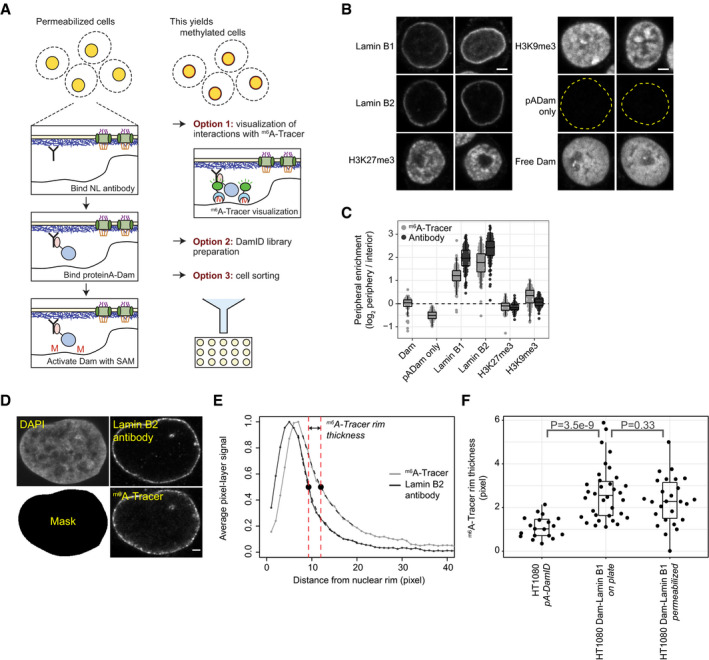
Figure 1. pA‐DamID can visualize NL interactions and does not affect peripheral genome organization.

-
ASchematic overview of pA‐DamID. Permeabilized cells are incubated with a primary antibody against a NL component, which in turn is bound by a pA‐Dam fusion protein. Nearby DNA is then m6A methylated upon Dam activation by incubation with SAM. The m6A pattern can be visualized by staining with fluorescent m6A‐Tracer protein, or mapped genome‐wide. Optionally, cells can be flow sorted to isolate specific cell populations prior to genome‐wide mapping of m6A. All steps are performed on ice, with the exception of 30‐minute Dam activation at 37°C.
-
BRepresentative confocal microscopy sections of m6A‐Tracer signal in HAP‐1 cells following pA‐DamID with indicated antibodies. pA‐Dam only: primary antibody was omitted, the dotted yellow line indicates DAPI segmentation. Free Dam: permeabilized cells were treated with freely diffusing pure Dam protein and SAM for 30 min. Scale bar corresponds to 2 μm.
-
CQuantification of peripheral enrichment of antibody staining and m6A‐Tracer signals after pA‐DamID with indicated antibodies. The nuclear rim and interior were segmented using DAPI signal and the mean m6A or antibody signal was determined and transformed to a log2 ratio. The nuclear rim mask extends slightly beyond the NL, resulting in underestimation of the real enrichment. Boxplots: horizontal lines represent 25th, 50th, and 75th percentiles; whiskers extend to the smallest values no further than 1.5 times distance between 25th and 75th percentiles. Every point represents a single cell; results are combined from two or three independent experiments.
-
DHT1080 cells expressing inducible Dam‐Lamin B1 (Kind et al, 2013) were treated with Shield1 to induce m6A methylation. Cells were either fixed immediately or processed according to the pA‐DamID protocol (as negative controls) and then fixed on poly‐L-lysine‐coated cover slips. Cells were imaged by confocal microscopy for the NL (Lamin B2 antibody) and methylation (m6A‐Tracer) for both conditions. Laser settings were changed between images to optimize image quality. The mask for defining the nuclear rim was obtained by segmentation of the DAPI image. The scale bar corresponds to 2 μm.
-
EFor every cell, the 50% decay distance from the nuclear periphery was determined for Lamin B2 and m6A‐Tracer by fitting exponential decay functions from the nuclear rim as defined by segmentation of the DAPI image (Mask in D, see Materials and Methods). The difference in 50% decay distance between Lamin B2 and m6A‐Tracer was used as a measure of the thickness of the m6A‐Tracer layer.
-
FDistribution of the m6A‐Tracer layer thickness for HT1080 cells expressing Dam‐Lamin B1, visualized before and after the pA‐DamID protocol. For comparison, a similar analysis was performed with HT1080 cells not expressing Dam‐Lamin B1, subjected to Lamin B2 pA‐DamID. Boxplots are as specified for (C). Every point represents a single cell; results are combined from three biological experiments, where every condition is assayed in at least two of those. Statistical significance was determined using a two‐way Wilcoxon test.
