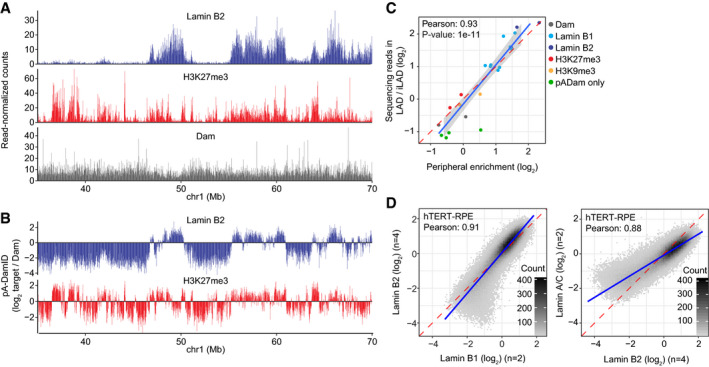
Figure 2. pA‐DamID can map NL interactions and correlates with microscopy observations.

-
AExample of raw pA‐DamID data tracks from 2 million HAP‐1 cells for Lamin B2, H3K27me3, and the Dam control from a single experiment. Sequenced reads are counted in 20 kb bins and normalized for library size.
-
BSame pA‐DamID tracks of Lamin B2 and H3K27me3 as in (A) but after normalization to the Dam‐only control (to correct for accessibility and amplification biases) and log2 transformation.
-
CCorrelation between the median peripheral enrichment of m6A‐Tracer determined by confocal microscopy and enrichment of sequencing reads within LADs in HAP‐1 cells. The LAD definition is based on conventional Lamin B1 DamID data. Every point represents a single pA‐DamID experiment for which both microscopy and sequencing data were generated, colored by the antibody used. The blue line represents a linear model with a standard error confidence interval in gray. The red dashed line represents the diagonal. The Pearson correlation coefficient was converted to a t‐statistic and a one‐sided t‐test with n‐2 degrees of freedom was used to determine statistical significance.
-
DComparisons of pA‐DamID genome‐wide data (bin size 20 kb) for different lamin antibodies in hTERT‐RPE cells: Lamin B1 vs. Lamin B2 (left panel) and Lamin B2 vs. Lamin A/C (right panel). n denotes the number of independent biological experiments that were averaged for each data track. The blue line represents a linear model. The red dashed line represents the diagonal.
