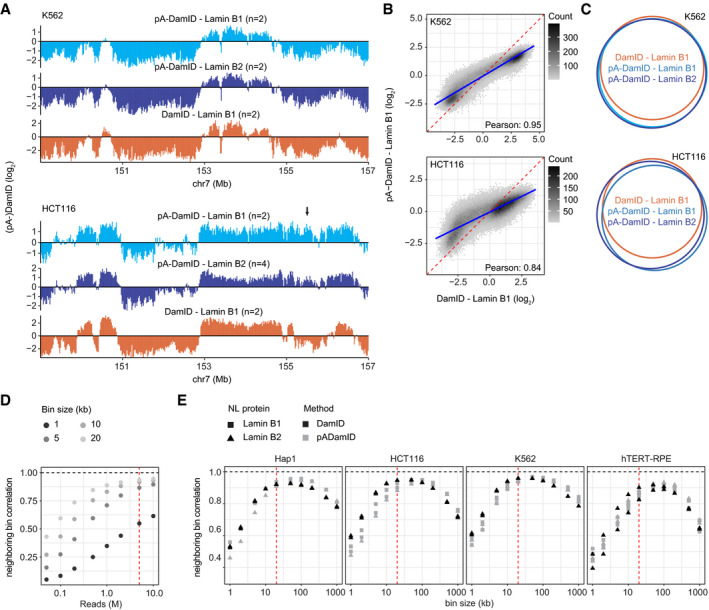
Figure EV2. Comparison of NL interactions determined by pA‐DamID and DamID for K562 and hTERT‐RPE cells.

-
A–CPlots similar to Fig 3A–C, but for K562 and HCT116 cells. Data are averages of n biological replicates (see panel A). Arrow indicates a region with dissimilar pA‐DamID and DamID scores (panel A). The blue line represents a linear model, and the red dashed line represents the diagonal (panel B).
-
DPearson correlation coefficients between neighboring bins on chromosome 1 for different bin sizes, calculated for increasing numbers of sequence reads that end in GATC. The red line highlights 5 million Lamin B2 and 5 million Dam counts, which is used in panel (E). Data are from Replicate 1 of Lamin B2 pA‐DamID in K562 cells.
-
ECorrelation between neighboring bins on chromosome 1 for pA‐DamID data downsampled to 5 million Lamin B2 and 5 million Dam sequence reads, calculated for various bin sizes. All pA‐DamID and DamID experiments for Lamin B1 and Lamin B2 are included that had sufficient read counts. The red line highlights the 20 kb bin size, which is used throughout this report.
