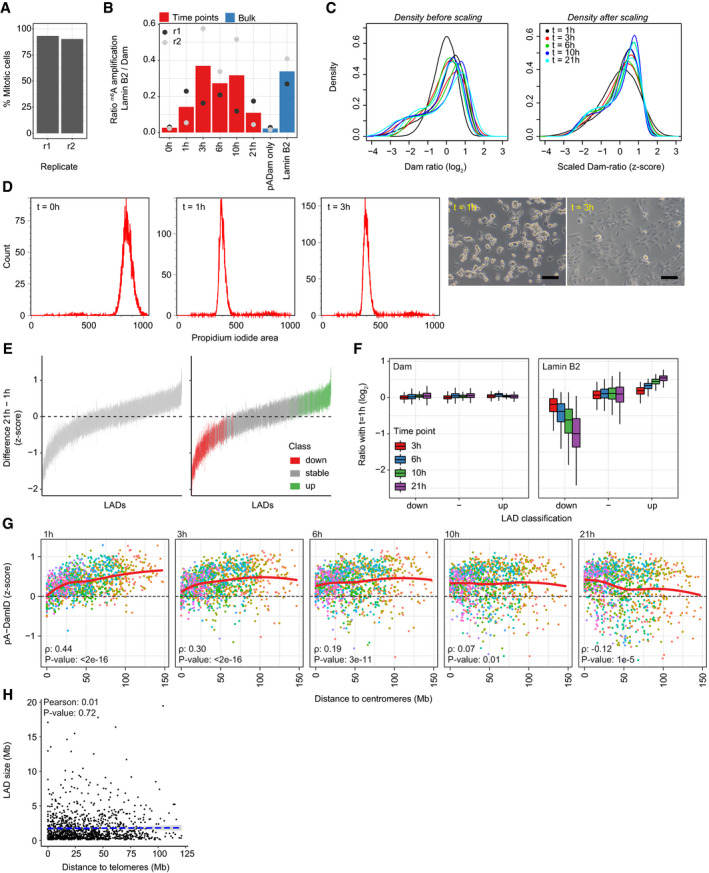
Figure EV3. Analysis of NL interactions at various times after mitosis.

-
ASynchronized cells were fixed on poly‐L-lysine‐coated cover slips and stained with DAPI. Percentage of mitotic cells was estimated by visual scoring of metaphase and anaphase appearance in confocal microscopy images. 207 and 82 cells were assessed in the two replicates (r1, r2), respectively.
-
BRatio of gel intensities from amplified m6A fragments between Lamin B2 pA‐DamID and Dam control, normalized for input DNA. For the second replicate, input DNA was very low for the time points and could not be determined accurately. These samples thus show a large variation in amplification ratio compared with the first replicate. The 0 h time point consistently shows low amplification ratios, similar to unsynchronized samples without a primary antibody. This indicates that genome–NL interactions at this time point are very weak.
-
CData distribution before and after scaling to z‐scores. The distributions are not affected by this transformation. Every line represents a single replicate.
-
DDensity plots of propidium iodide (PI) signals of hTERT‐RPE cells following mitotic shake‐off and replating (left). Example light microscopy of hTERT‐RPE cells following replating (right). The scale bar corresponds to 100 μm.
-
EOverview of the classification of dynamic LADs. LADs were defined for every time point by selecting LADs that are called in both replicates using hidden Markov modeling, after which a union across time points was used as consensus LAD definition. For every LAD, per‐bin z‐score differences are calculated between 1 h and 21 h, and a line is drawn between the 25th and 75th percentiles of these values. This shows that numerous LADs change as complete units between 1 h and 21 h. The right panel shows the same figure, but is colored by LAD classification into stable and dynamic using limma‐voom differential analysis (Materials and Methods).
-
FRead counts for Dam and Lamin B2 (normalized for overall sequencing read depth) were calculated for stable and dynamic LADs. Plotted are log2‐ratios relative to the 1 h time point. This shows that Dam reads do not change between time points. Average two of biological replicates. Boxplots: horizontal lines represent 25th, 50th, and 75th percentiles; whiskers extend to the smallest values no further than 1.5 times distance between 25th and 75th percentiles.
-
GSimilar figure as Fig 4I, showing distance to centromeres instead.
-
HLAD size is not correlated with distance to telomeres (Pearson correlation coefficient: 0.01). The blue dashed line represents a linear model.
