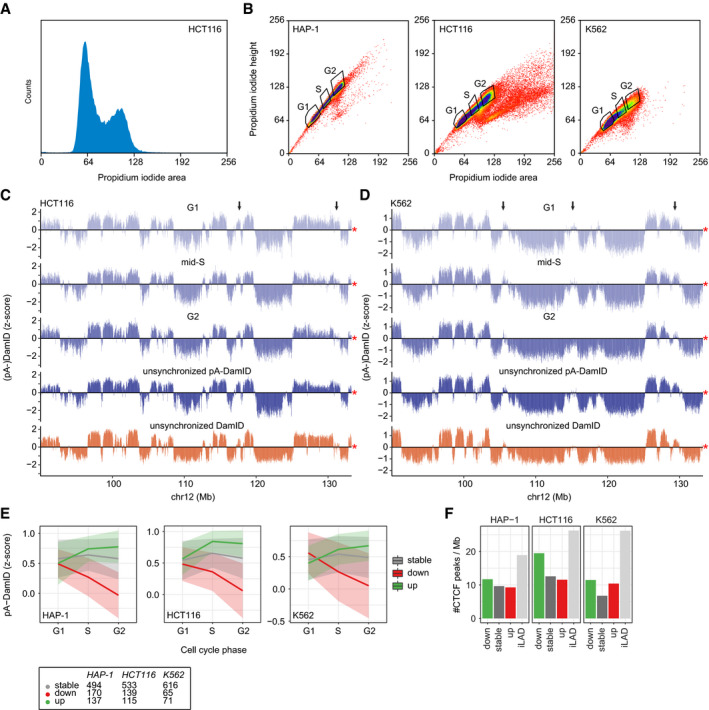
Figure EV4. LAD dynamics in flow sorted HCT116 and K562 cells.

-
ADensity plot of propidium iodide (PI) signals of HCT116 cells after application of the pA‐DamID protocol and PI staining.
-
BSorting strategy of pA‐DamID processed cells stained PI. Single cells were selected based on PI height and area and sorted into three pools: G1, mid‐S, and G2. G1 and G2 gates were set around the two PI peaks (see also A). The mid‐S gate was set to covering intermediate PI signals, clearly distinct from the G1 and G2 peaks. For every condition, 2 or 3 wells were filled with 1,000 cells and processed to generate one sequencing library.
-
C, DSame locus as Fig 5A for HCT116 (C) (n = 2) and K562 cells (D) (n = 2). The arrows highlight dynamic regions. The red asterisk indicates the end of the chromosome.
-
ESimilar plot as Fig 4C, with cell cycle stages on the x‐axis. The numbers of stable and dynamic LADs are shown for the three cell types.
-
FCTCF ChIP‐seq peak density per Mb for stable and dynamic LADs. iLADs are defined as genomic regions not overlapping with stable or dynamic LADs. CTCF data are from (Consortium EP, 2012; Haarhuis et al, 2017). A permutation test with 1,000 permutations (R‐package regioneR (Gel et al, 2016)) was used to test for a significant enrichment of CTCF peaks in decreasing LADs, resulting in P‐values of 1e‐3, 1e‐3, and 1e‐3 for HCT116, HAP‐1, and K562, respectively.
