
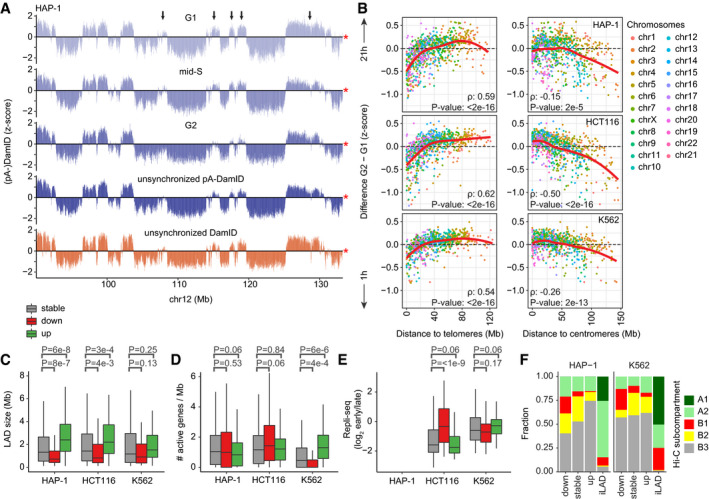
Figure 5. LAD dynamics in other cell types.
-
ALamin B2 pA‐DamID z‐scores of a representative locus in HAP‐1 cells sorted for G1, mid‐S, and G2 phases. Arrows point to regions that lose NL interaction from G1 to G2. The red star indicates the end of the chromosome. Average of three biological replicates.
-
BSimilar plot as Fig 4H, showing the difference in pA‐DamID z‐scores between G2 and G1 sorted pools as function of distance to either telomere or centromere for HAP‐1 (n = 3), HCT116 (n = 2), and K562 cells (n = 2).
-
C–ELAD size distribution in basepairs (C), density of active genes (D) and Repli‐seq scores (E) for stable and dynamic LADs. Repli‐seq data are not available for HAP‐1 cells. Statistical significance was determined using a two‐way Wilcoxon test with Benjamini–Hochberg P‐value correction to account for multiple testing. Boxplots: horizontal lines represent 25th, 50th, and 75th percentiles; whiskers extend to the smallest values no further than 1.5 times distance between 25th and 75th percentiles.
-
FOverlapping fractions of stable and dynamic LADs and iLADs with Hi‐C subcompartments in HAP‐1 and K562 cells, as imputed by SNIPER (Xiong & Ma, 2019). A permutation test with 1,000 permutations (R‐package regioneR; Gel et al, 2016) was used to test for a significant enrichment of B1 subcompartments in decreasing LADs, resulting in P‐values of 1e‐3 and 1e‐3 for HAP‐1 and K562, respectively.