
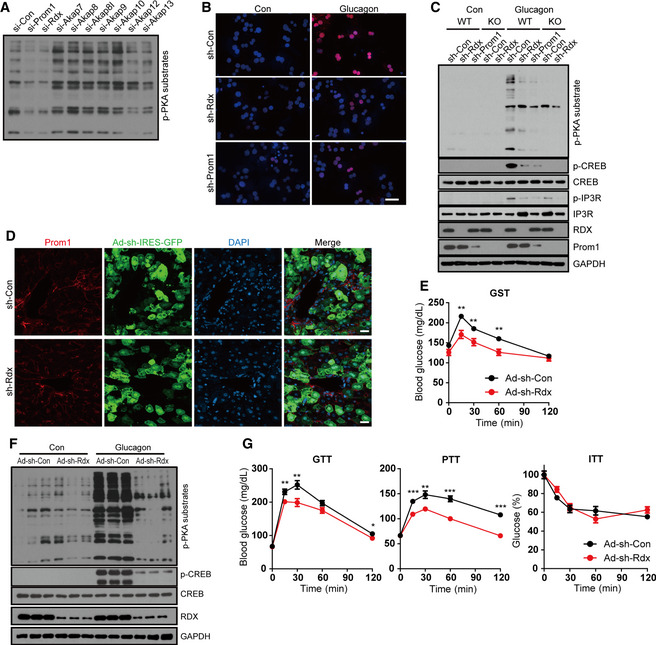
Figure 4. Radixin is the AKAP required for glucagon‐induced PKA activation and hyperglycemia in vivo .
-
AThe expression of Prom1, radixin, AKAP7, AKAP8, AKAP8I, AKAP9, AKAP10, AKAP12, or AKAP13 was silenced in WT hepatocytes using siRNAs. Hepatocytes were then serum‐starved for 18 h and stimulated with glucagon (10 nM) for 10 min. The phosphorylation of PKA substrates was determined by immunoblotting.
-
B, CProm1 and radixin expression was silenced in WT (Prom1 +/+) and KO (Prom1 −/−) hepatocytes by infection with an adenovirus harboring sh‐control (sh‐Con), sh‐radixin (sh‐Rdx), or sh‐Prom1 for 24 h. Hepatocytes were further serum‐starved for 18 h and stimulated with glucagon (10 nM) for 10 min. (B) The nuclear localization of p‐CREB after glucagon stimulation was determined by immunofluorescence staining. Blue; DAPI, Red; p‐CREB. The percentage of cells with nuclear p‐CREB staining among more than 300 cells in each group was also statistically analyzed (Fig EV3G). Scale bar, 20 μm. (C) Levels of p‐PKA substrates, p‐CREB, CREB, p‐IP3R, IP3R, Prom1, radixin, and GAPDH after glucagon stimulation (10 min) were determined by immunoblotting.
-
DImmunofluorescence staining of Prom1 in mouse liver transduced with adenoviral particles. Confocal microscope images of WT mouse liver infected with adenovirus harboring sh‐Con or sh‐Rdx linked with IRES‐GFP. Scale bar, 20 μm.
-
E–G12-week‐old male wild‐type mice were infected with an adenovirus harboring sh‐control (sh‐Con) or sh‐radixin (sh‐Rdx) for 3 days, fasted for 4 h, and intraperitoneally injected with glucagon. (E) Blood glucose levels (mg/dL) were measured 0, 15, 30, 60, and 120 min after glucagon administration (200 μg/kg body weight, n = 10 mice/group). (F) Levels of p‐PKA, p‐CREB, CREB, radixin, and GAPDH in the liver after a 10‐min of glucagon stimulation (2 mg/kg body weight) were determined by immunoblotting. (G) Glucose disposal rates in sh‐Con or sh‐Rdx (radixin) mice were measured using glucose, insulin, and pyruvate tolerance tests (n = 10 mice/group).