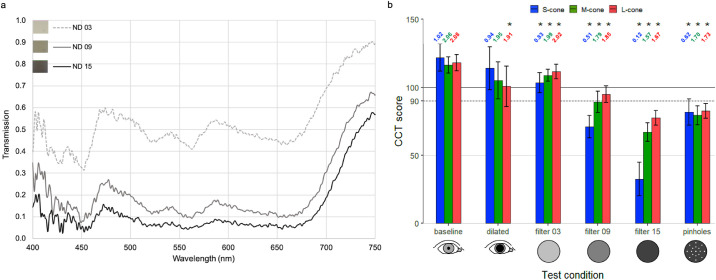
Figure 1.
(a) Spectral transmission of NDs. (b) Effect of testing conditions on CCT scores. This was estimated via linear regression with generalized estimating equations to account for repeated measurements (n = 18). Error bars represent 95% CI with Bonferroni correction (α = 0.05/18 = 0.0028) and correspond to 2.77 times the standard error of the mean CCT score for each group. *Statistically significant differences from baseline. LogCS scores are included above each bar of Figure 1b.

