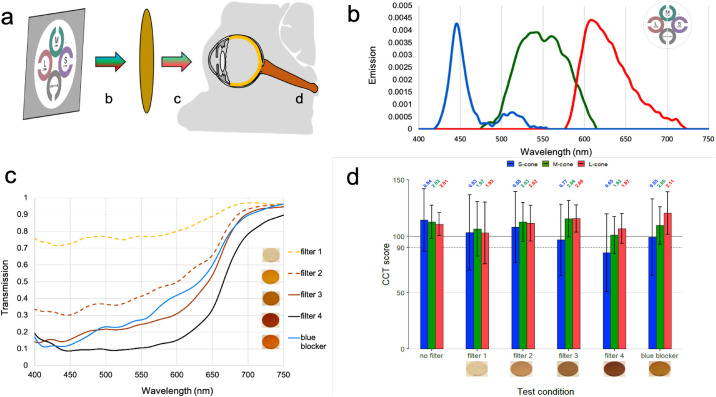
Figure 2.
(a) Configuration for measuring cone contrast sensitivity from the ColorDx monitor, with (b) spectral emission of the CCT monitor, (c) spectral transmission of brown filters, and (d) effect of simulated cataractous changes on CCT scores. Error bars represent 95% CI with Bonferroni correction (α = 0.05/18 = 0.0028) and correspond to 2.77 time the standard error of the mean CCT scores for each group. *Statistically significant differences from baseline (n = 6). LogCS scores are included above each bar of Figure 2d.

