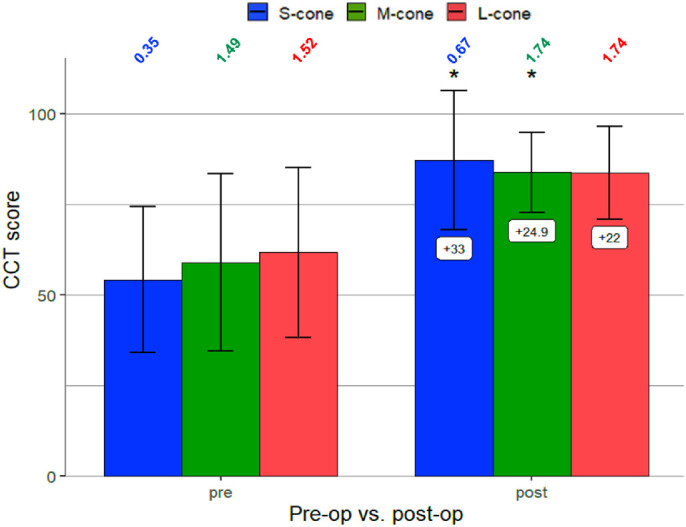
Figure 4.

Changes in color vision before and after cataract surgery (n = 25). Error bars represent 95% CI with Bonferroni correction (α = 0.05/18 = 0.0028) and correspond to 2.77 times the standard error of the mean CCT score. *Mean changes significant. LogCS scores are included above each bar of Figure 4.
