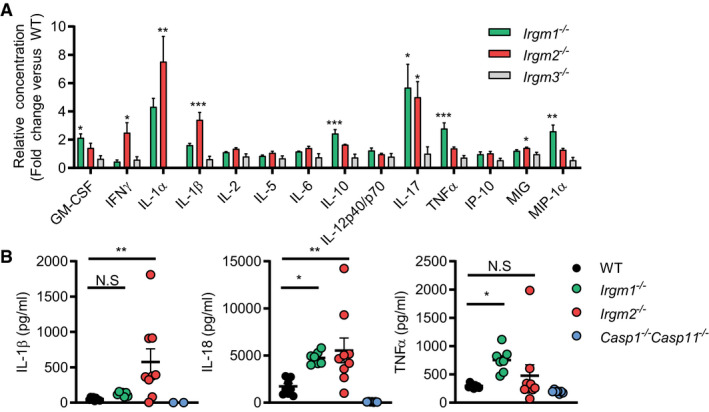
Figure 1. Irgm1 and Irgm2 but not Irgm3 limit the production of inflammatory cytokines in response to LPS in vivo .

- WT, Irgm1 −/−, Irgm2 −/−, and Irgm3 −/− mice (n = 4 mice/genotype) were injected i.p. with LPS (8 mg/kg). Serum was collected 4 h post‐injection (hpi) and concentration of various cytokines determined via a preconfigured Luminex multiplex panel. Relative concentration (fold change relative mean of WT) is shown for the indicated cytokines (absolute cytokine concentrations of same experiment are shown in Fig EV1).
- WT (n = 9), Irgm1 −/− (n = 7), Irgm2 −/− (n = 9), and Casp1 −/− Casp11 −/− (n = 7) mice were injected i.p. with LPS (8 mg/kg). Serum was collected 4 hpi and concentration of IL‐1β, IL‐18, and TNFα was measured via ELISA.
