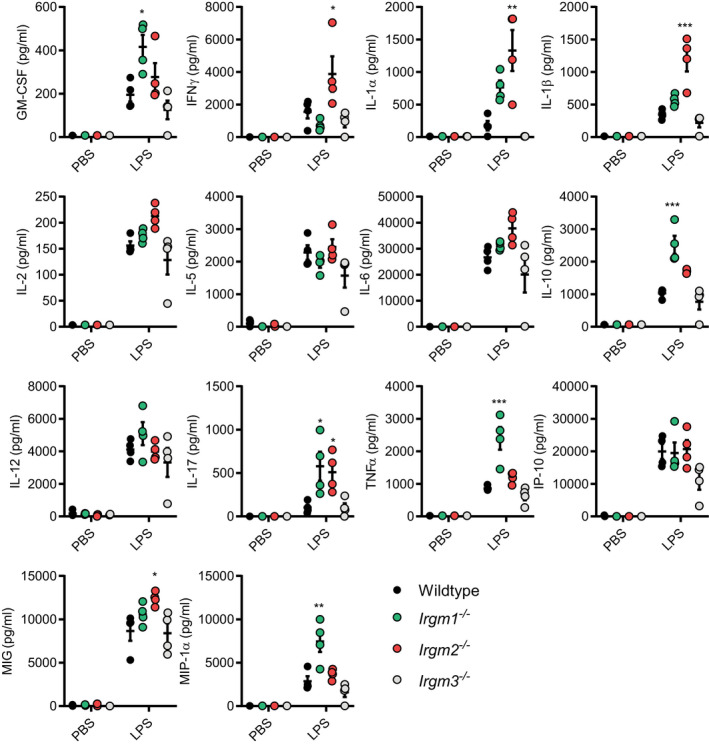
Figure EV1. Absolute quantification of multiplex cytokine data of PBS‐ and LPS‐treated WT and Irgm‐deficient mouse strains.

WT, Irgm1 −/−, Irgm2 −/−, and Irgm3 −/− mice were injected i.p. with LPS (8 mg/kg in PBS) or PBS alone. Serum was collected 4 hpi and concentration of indicated cytokines determined via Luminex platform (these data are shown normalized to WT mice in Fig 1A). n = 4 mice/genotype for all groups, except Irgm1 −/− + PBS where n = 3. Data information: Data shown are means ± SEM. *P < 0.05, **P < 0.01, ***P < 0.001 for comparison between WT and indicated genotype by one‐way ANOVA with Dunnett's multiple comparison test.
