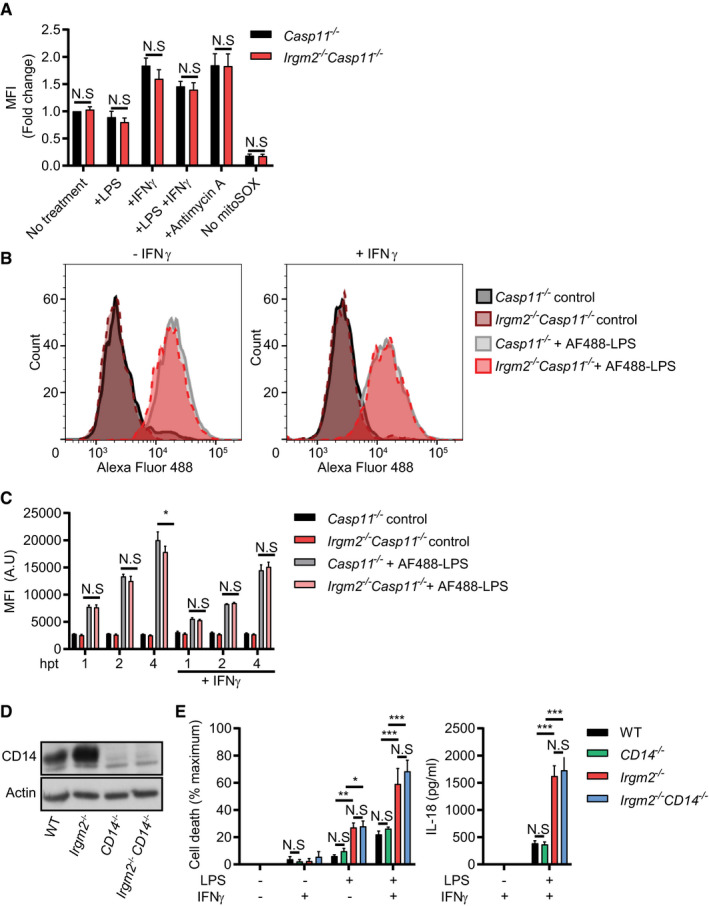
IFNγ‐primed and unprimed Casp11
−/− and Irgm2
−/−
Casp11
−/− BMMs were treated with LPS (1 μg/ml) for 3 h, antimycin A for 30 min or were left untreated. Cells were then stained with mitoSOX red and fluorescence measured via flow cytometry. For each experiment, mean fluorescence intensity (MFI) was normalized to untreated Casp11
−/− BMMs.
IFNγ‐primed and unprimed Casp11
−/− and Irgm2
−/−
Casp11
−/− BMMs were treated with Alexa Fluor 488‐conjugated LPS or unconjugated LPS (control) for 4 h and Alexa Fluor 488 cell fluorescence measured via flow cytometry. Representative flow cytometry data are depicted.
IFNγ‐primed and unprimed Casp11
−/− and Irgm2
−/−
Casp11
−/− BMMs were treated with Alexa Fluor 488 conjugated LPS or unconjugated LPS (control) for 1, 2, or 4 h and fluorescence measured via flow cytometry. MFI (A.U) = Mean fluorescent intensity (arbitrary units).
Lysates from WT, CD14
−/−, Irgm2
−/−, and Irgm2
−/−
CD14
−/− BMMs were assessed for CD14 and actin protein levels via immunoblotting.
IFNγ‐primed and unprimed WT, CD14
−/−, Irgm2
−/−, and Irgm2
−/−
CD14
−/− BMMs were treated with LPS (1 μg/ml) for 24 h and LDH and IL‐18 release measured.
Data information: Data shown are means ± SEM from
n = 4 (A) or
n = 3 (C, E) independent experiments. *
P < 0.05, **
P < 0.01, ***
P < 0.001 for indicated comparisons by two‐way ANOVA with Tukey's multiple comparisons test. (B) represents one of three independent experiments. (D) is representative of two independent experiments. N.S, non significant.
Source data are available online for this figure.

