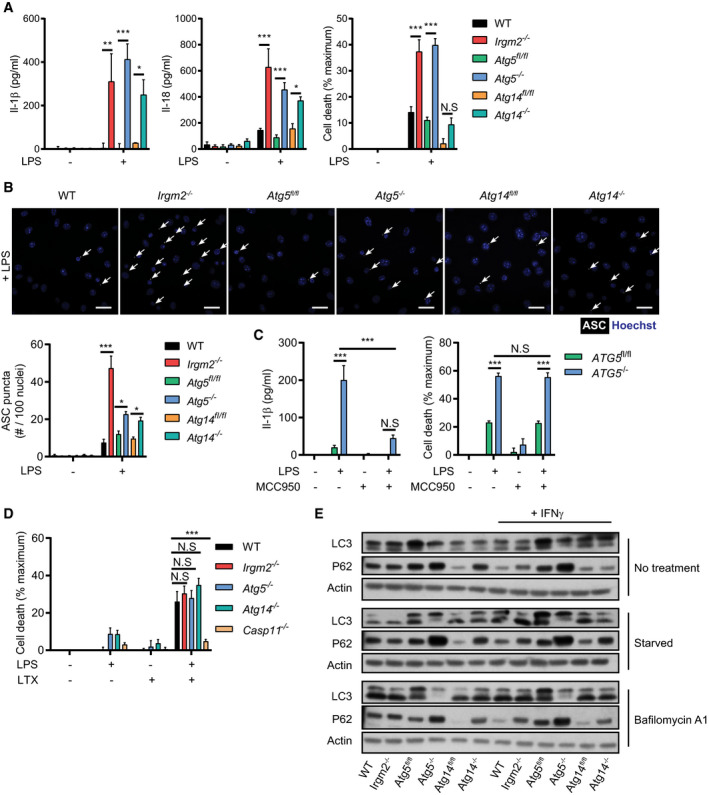
WT, Irgm2
−/−, Atg5
fl/fl, LysMCre‐Atg5
f/f (Atg5
−/−), Atg14
fl/fl and LysMCre‐Atg14
f/f (Atg14
−/−) BMMs were treated with LPS (1 μg/ml) and IL‐1β, IL‐18, and LDH release were assessed at 24 hpt (n = 4 independent experiments for IL‐1β, IL‐18 and n = 7 independent experiments for LDH release).
IFNγ‐primed BMMs of the indicated genotypes were treated with LPS (5 μg/ml) for 4 h and subsequently stained with anti‐ASC antibody and Hoechst stain (DNA/nuclei). Representative images are shown with white arrows pointing at ASC specks. Number of ASC specks per nuclei was quantified. Scale bars: 20 μm. (n = 3 independent experiments, >200 nuclei counted for each condition/replicate)
Atg5
fl/f and LysMCre‐Atg5
f/f (Atg5
−/−) BMMs were treated with LPS (1 μg/ml) and/or MCC950 for 24 h and IL‐1β/LDH release was measured (n = 3 independent experiments).
IFNγ‐primed BMMs of the indicated genotypes were transfected with LPS using lipofectamine LTX and LDH release measured 2 hpt (n = 5 independent experiments).
IFNγ‐primed BMMs of the indicated genotypes were stimulated overnight with IFNγ or left untreated. Cells were then starved for 2 h in HBSS or were treated with Bafilomycin A1 (100 nM), and cell lysates were collected. Lysates were assessed for LC3, p62, and actin protein levels via immunoblotting. Image is representative of n = 3 independent experiments.
Data information: Graphs show means ± SEM. *
< 0.001 for indicated comparisons by two‐way ANOVA with Tukey's multiple comparisons test. N.S, non‐significant.

