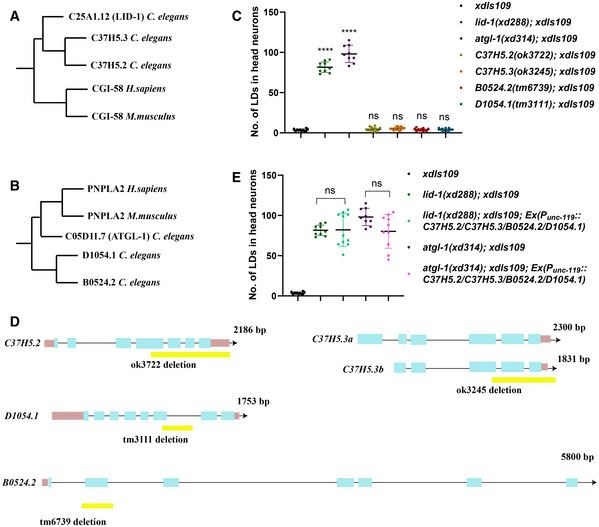
Figure EV1. The paralogs of ATGL‐1 and LID‐1 do not affect neuronal LD dynamics.

-
A, BThe evolutionary phylogenetic trees of LID‐1 and ATGL‐1.
-
CMutations in genes encoding LID‐1 or ATGL‐1 paralogs do not affect LD dynamics in neurons. Each dot represents one worm. The data were analyzed using one‐way ANOVA with Dunnett's multiple comparison test. Asterisks denote significant differences as compared to the control xdIs109. ns: not statistically significant. ****P < 0.0001. Data show mean ± SEM. n ≥ 9.
-
DSchematic diagrams of alleles of LID‐1/ATGL‐1 paralogs. The coding regions are in blue boxes and the noncoding regions are shown as lines. The UTRs are in pink boxes. The yellow boxes show the regions deleted in the corresponding alleles.
-
ENeuronal expression of LID‐1 and ATGL‐1 paralogs does not rescue lid‐1(xd288) or atgl‐1(xd314). Each dot represents one worm. The data were analyzed using one‐way ANOVA with Tamhane's T2 multiple comparison test. ns: not statistically significant. Data show mean ± SEM. n ≥ 9.
