
Figure 1. hMENA isoform expression in CAFs.
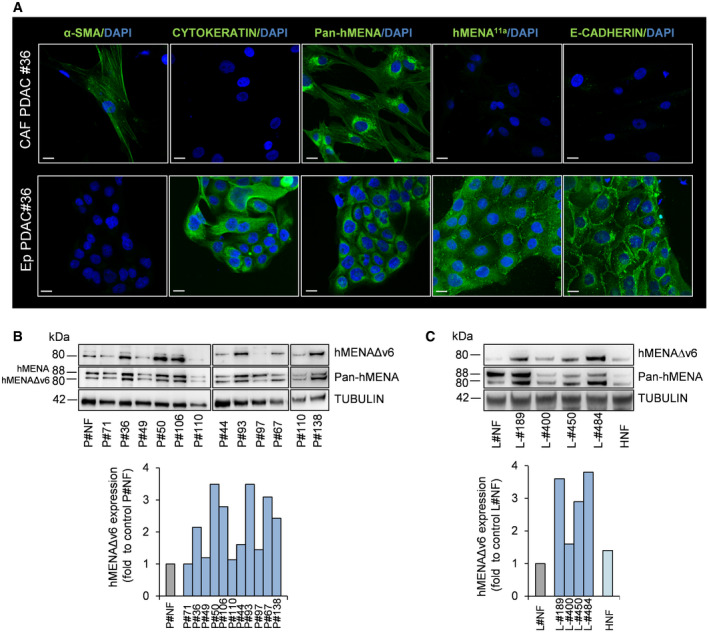
- Representative images of immunofluorescence of α‐smooth muscle actin (α‐SMA), pan cytokeratin, Pan‐hMENA, hMENA11a, and E‐cadherin expression in CAFs and autologous cancer cells (Ep‐PDAC) obtained from enzymatically digested primary PDAC tissue of patient #36. Nuclei were stained with 4′,6‐diamidino‐2-phenylindole (DAPI). Scale bar: 20 μm.
- Representative immunoblot (top) of hMENA/hMENAΔv6 expression levels (detected by Pan‐hMENA mAb and by the specific anti‐hMENAΔv6 antibody) in normal fibroblasts derived from transplant donor (P‐NF), pancreatic serous cystadenoma #71, and cancer‐associated fibroblasts (n = 10) obtained from primary PDAC tissues. Densitometry quantified data (bottom) of hMENAΔv6 expression. Quantification of P#110 is relative to the sample shown in the WB on the left.
- Representative immunoblot (top) of hMENA/hMENAΔv6 expression levels (detected by Pan‐hMENA mAb and by the specific anti‐hMENAΔv6 antibody) in normal lung fibroblasts (L‐NF), cancer‐associated fibroblasts obtained from NSCLC tissues (n = 4), and normal dermal fibroblasts (HNF). Densitometry quantified data (bottom) of hMENAΔv6 expression.