
Figure 2. hMENA expression in tumor and stroma of PDAC and NSCLC tissues.
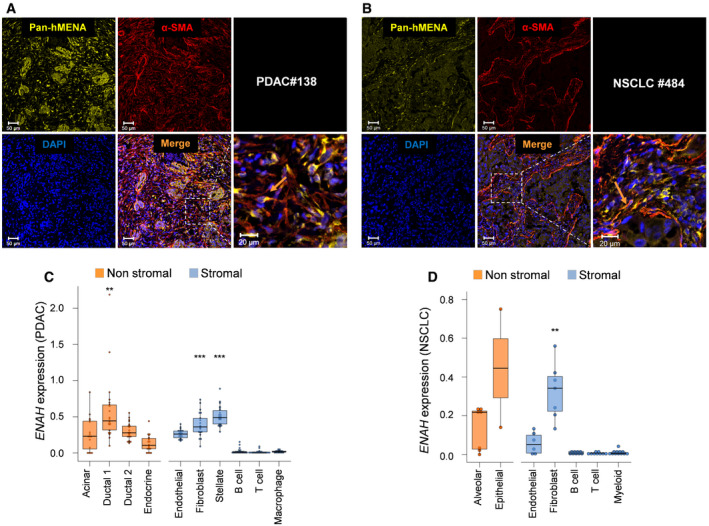
- Representative images of immunofluorescence of Pan‐hMENA (yellow) and α‐SMA (red) in the primary PDAC tissue of patient #138 from whom high hMENAΔv6 CAFs were obtained. Nuclei were stained with 4′,6‐diamidino‐2-phenylindole (DAPI). Scale bar: 50 μm. The inset of the dashed area is provided on the right as a zoomed‐in and cropped fluorescence image. Scale bar: 20 μm. αSMA‐positive CAFs are also positive for Pan‐hMENA (arrow).
- Representative images of immunofluorescence of Pan‐hMENA (yellow) and α‐SMA (red) in NSCLC case #484 from whom high hMENAΔv6 CAFs were obtained. Nuclei were stained with 4′,6‐diamidino‐2-phenylindole (DAPI). Scale bar: 50 μm. The inset of the dashed area is provided on the right as a zoomed‐in and cropped fluorescence image. Scale bar: 20 μm. As in A, α‐SMA signal is evident in stromal cells which are also positive for Pan‐hMENA (arrow).
- Boxplots showing the mean mRNA expression of ENAH gene (hMENA) for 22 patients in the 10 groups of cell types (Peng et al, 2019; total number of cells: 38,487, mean of cells for patient: 1,603). Shown in each boxplot are the median value (horizontal line), 25th–75th percentiles (box outline), and highest and lowest values within 1.5× of the interquartile range (vertical line). Expressions from each cell‐type group were compared to all other groups by using Mann–Whitney U‐test (two‐sided) and P values were adjusted for multiple testing using the Benjamini–Hochberg method. Stromal cell‐type groups with significantly up‐regulated ENAH expression respect to other stromal groups are: Fibroblast, ***q = 0.0002; Stellate, ***q = 1.5e‐07. Non‐stromal cell‐type groups with significantly up‐regulated ENAH expression with respect to other non‐stromal groups are: Ductal 1, **q = 0.0013.
- Boxplots showing the mRNA expression of ENAH gene (hMENA) in the seven groups of cell types from (Lambrechts et al, 2018) (total n = 52). Shown in each boxplot are the median value (horizontal line), 25th–75th percentiles (box outline), and highest and lowest values within 1.5× of the interquartile range (vertical line). Cell expression from each group were compared to all other stromal/not-stromal cells by using Mann–Whitney U‐test (two‐sided) and P values were adjusted for multiple testing using the Benjamini–Hochberg method (Fibroblast group vs other stromal groups, **q = 0.0022; Other comparisons, q > 0.05).